SAP Cloud ALM – What’s New in Week 44
SAP Cloud ALM keeps advancing – this week’s updates focus on clarity, structure, and smarter control.
The week 44 release brings a reorganized extensibility view in RISE with SAP, extended security coverage and monitoring in Operations, and improved project organization and usability in Implementation.
Together, these updates strengthen transparency across systems, simplify daily work, and help teams deliver with greater confidence and precision.
RISE with SAP – System View
The latest updates in the RISE with SAP area focus on strengthening clean core transparency and extensibility governance. With the introduction of the new Clean Core Level Concept, the System View dashboard now provides a clearer, more structured view of how custom code and extensions align with SAP’s clean core principles – helping customers manage technical debt, plan modernization, and maintain upgrade stability.
Extensibility Section Reorganized
The Extensibility section of the System View dashboard has been completely restructured to align with the new Clean Core Level Concept for SAP S/4HANA Cloud, replacing the legacy 3-Tier Extensibility model.
This change modernizes how extensibility compliance is visualized, making it easier for users to distinguish between upgrade-stable, clean-core-compliant extensions and those that may require remediation.
Under the new model, all extensions are categorized into four Clean Core Levels (A-D), which describe how closely each extension aligns with the clean core principles for SAP S/4HANA Cloud:
- Level A: Extensions that are built with released SAP APIs and ABAP for Cloud Development, and are considered fully cloud-compliant.
- Level B: Extensions that are partially aligned with the clean core guidelines and may require adjustments to reach full compliance.
- Level C: Extensions that use classic extensibility approaches and should be modernized over time.
- Level D: Extensions that are not compliant with the clean core principles and should be addressed with high priority.

The updated section introduces several new KPI cards to provide a clearer picture of system extensibility and technical debt:
- Technical Debt Score – Evaluates modernization needs based on clean core compliance.
- Execution of Customer Objects – Shows how frequently custom objects are executed compared to standard ones.
- Business Modifications – Highlights legacy modifications that may affect upgrade stability.
- Unused Customer Objects – Identifies unused extensions that can be cleaned up.
- Clean Core Share – Measures the overall share of compliant extensions.
- Detailed Level Overview (A-D) – Provides visibility into the distribution of extensions by clean core level.

By integrating the Clean Core Level Concept, the dashboard offers greater transparency into custom code usage and a practical foundation for modernization planning.
As part of this transition, the following cards have been removed from the dashboard:
- Setup for ABAP Cloud Development
- ABAP Cloud: Level A Objects
- ABAP Classic: Business Modifications
- Button linking to the Custom Code Analytics dashboard
TL;DR:
The Extensibility section now follows SAP’s Clean Core Level Concept (A-D), introducing new KPIs like Technical Debt Score and Clean Core Share for a clearer, more structured view of your system’s extensibility landscape.
Operations – Configuration & Security Analysis, Health Monitoring, Business Service Management, Real User Monitoring
The latest updates in the Operations area continue to strengthen SAP Cloud ALM’s monitoring and compliance capabilities. From extended security validation coverage for SAP HANA Cloud and SuccessFactors services, to new Event Mesh metrics in Health Monitoring, and smarter changepoint detection in Real User Monitoring – these enhancements help operations teams gain deeper insights, act faster, and maintain a clean, secure landscape.
Expanded Service Coverage – Configuration & Security Analysis
The Configuration & Security Analysis app continues to broaden its scope with new integrations that help operations teams strengthen security compliance and configuration transparency across a wider range of SAP services.
Users can now analyze configuration items and view compliance results against SAP’s official security recommendations for the following additional services:
- SAP HANA Cloud
- SAP HANA Cloud, Data Lake
- SAP SuccessFactors Agent Lifecycle Management
- SAP SuccessFactors Agent Performance Management
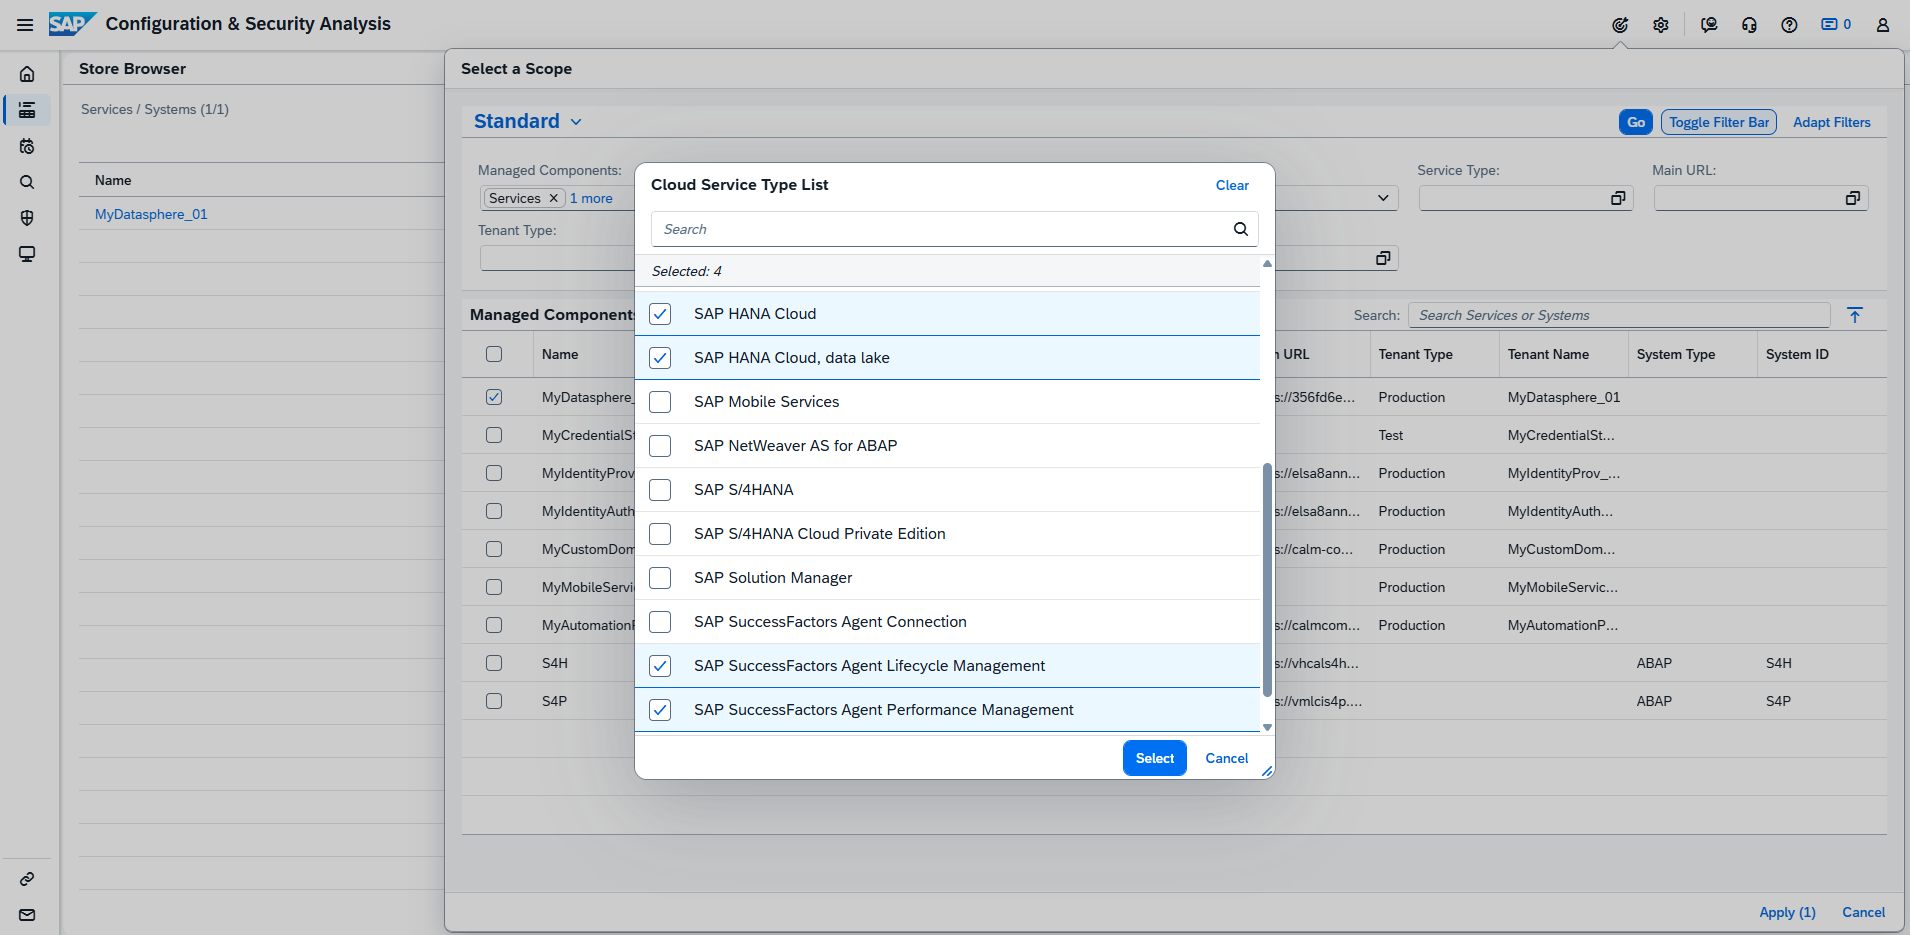
These additions make it easier for administrators and security teams to centrally monitor adherence to SAP’s best practices across multiple SAP cloud services. The compliance results highlight deviations from recommended configurations, enabling faster remediation and more consistent governance.
Configuration for these services can be managed directly in the Configuration & Security Analysis – Data Stores app. Validation of Security Recommendations can be viewed in Configuration & Security Analysis – Validation app.
TL;DR:
Configuration & Security Analysis now supports SAP HANA Cloud, HANA Cloud Data Lake, SuccessFactors Agent Lifecycle Management, and Agent Performance Management, providing broader visibility and security compliance insights across SAP cloud environments.
Support for SAP Integration Suite (Event Mesh) – Health Monitoring
Health Monitoring now extends its coverage to include SAP Integration Suite (Event Mesh), giving operations teams better visibility into the health and performance of their event-driven integration scenarios.
With this enhancement, users can monitor key Event Mesh metrics directly within SAP Cloud ALM, including:
- Message Consumers
- Active Connections
- Broker State
- Message Queues
- Message Spool Usage
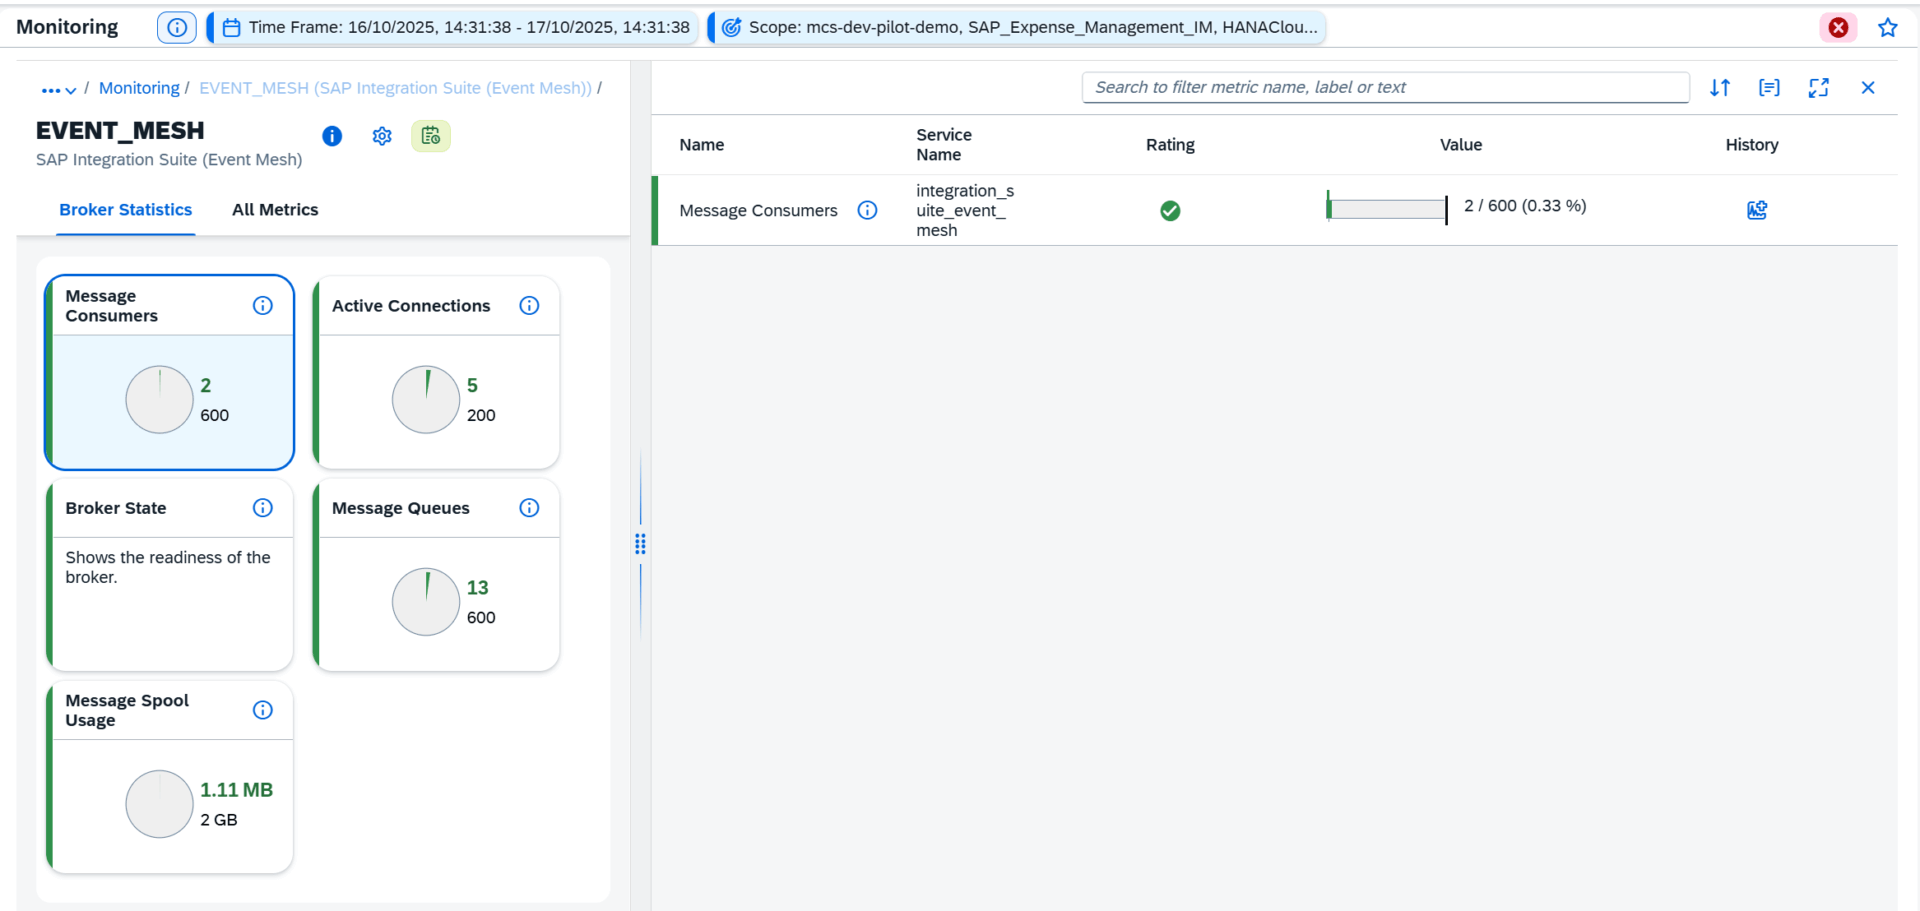
By tracking these metrics, administrators can proactively identify bottlenecks, assess system load, and ensure event distribution runs reliably across connected systems.
TL;DR:
Health Monitoring now supports SAP Integration Suite (Event Mesh), adding metrics for message flow, connection status, and broker performance to improve operational oversight.
Event Actions for Past Events – Business Service Management
The Business Service Management app now supports event actions for past status events, such as Disruption and Degradation events, even when both their start and end times have already occurred.
Previously, event actions like ticket creation, email, or chat notifications were not triggered for retrospective events generated by SAP for Me. With this enhancement, teams can now apply the same automated workflows to past events, ensuring that all incidents – past or current – are consistently documented and communicated.

Supported event actions include:
- Create Ticket – Automatically generates and closes a ticket when a past event occurs, including details from root cause analysis.
- Send Mail – Sends an email notification after an event or root cause analysis is completed, based on your settings.
- Send Chat Notification – Sends a chat alert after an event or analysis is finished, ensuring team awareness.
- Start Operation Flow – Triggers an operation flow automatically after the event occurs, following the configured rules.
This enhancement improves visibility, traceability, and post-incident analysis for business service health management.
TL;DR:
Users can now trigger ticketing, mail, chat, and operation flow actions for past SAP for Me events, improving retrospective analysis and service management consistency.
Alerts for Changepoint Detection – Real User Monitoring
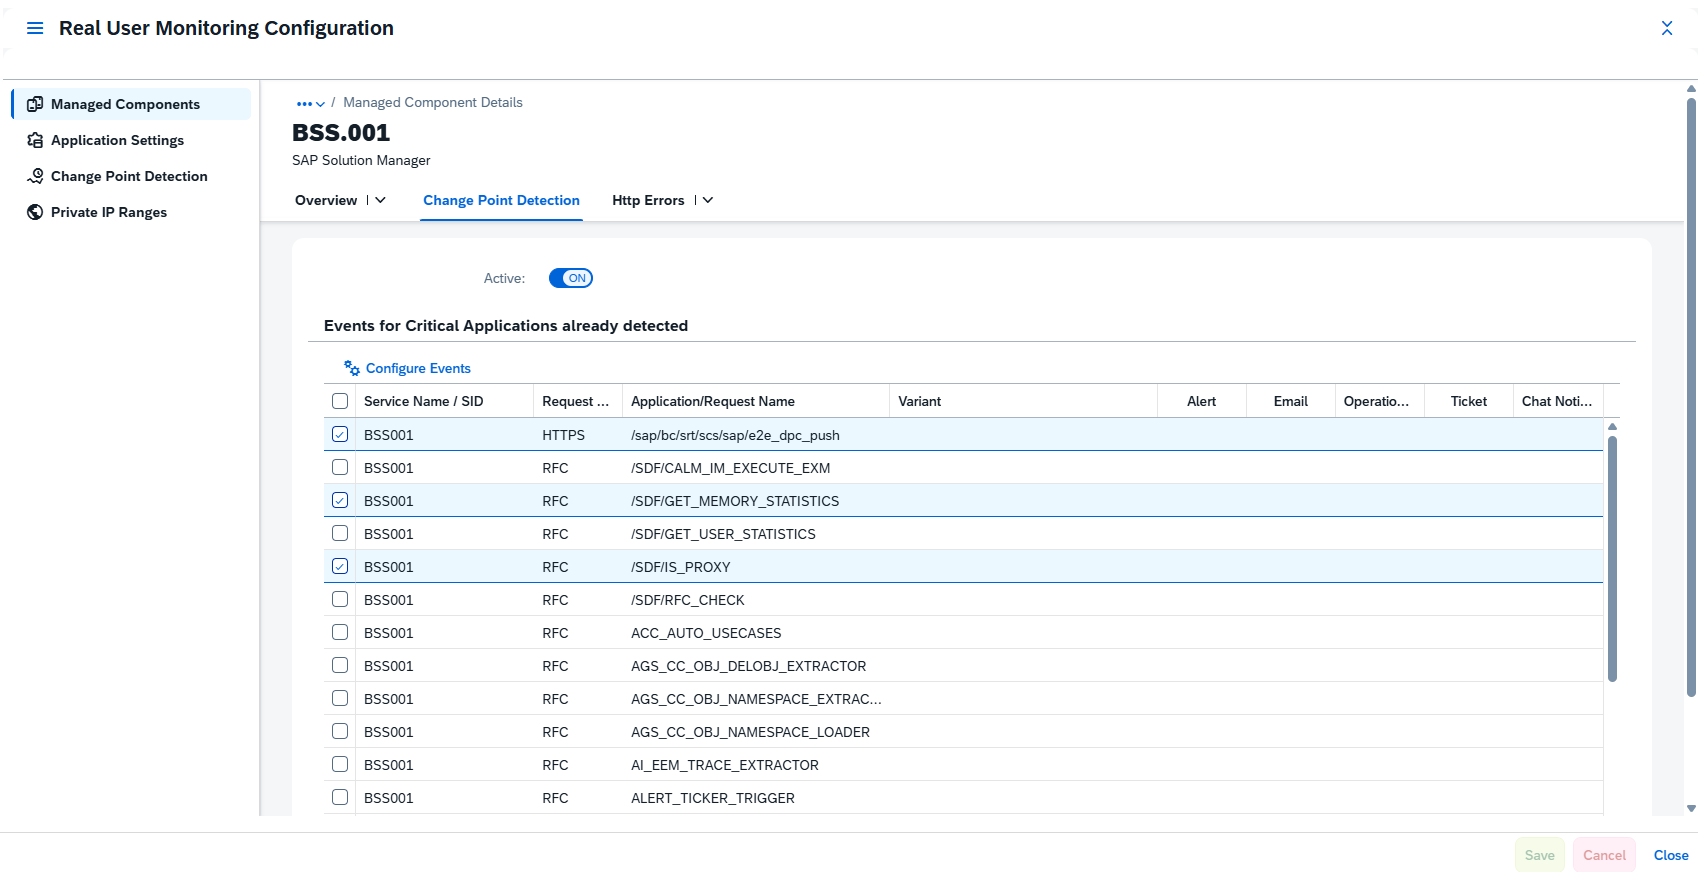
Real User Monitoring now includes changepoint detection alerts, enabling proactive identification of unusual performance shifts across your monitored systems and services.
A changepoint represents a statistically significant deviation in request performance – such as a sudden spike or drop in response time – compared to recent behavior. SAP Cloud ALM continuously evaluates metrics within a sliding time window, adapting the analysis length to request frequency.
Changepoints are detected for the following backend request types:
- HTTP / HTTPS
- RFC / RFCS
- Dialog
- Web Service (WS)
Detected changepoints appear on a timeline for all systems and services in scope, visually highlighting periods of performance degradation (marked in red). Selecting a changepoint displays key details such as:
- Request type and name
- Time window of impact
- Measured response times and trends
With this update, you can also create alerts for changepoints, automatically notifying your team of anomalies that may require investigation. This significantly improves situational awareness and shortens the time to detect and resolve performance issues.
TL;DR:
Real User Monitoring now detects and alerts on changepoints – short-term performance shifts across HTTP, RFC, and other request types – helping teams quickly spot and act on emerging issues.
Implementation – Project Overview, Projects and Setup, Process Authoring, Processes
The latest updates in the Implementation area focus on improving project clarity, structure, and usability. With new tools to visualize risks, group projects into programs, simplify process relations, and create test cases directly in the Processes app, project teams can manage complexity more efficiently and keep execution tightly aligned with testing and governance.
New Risks Card in Project Overview
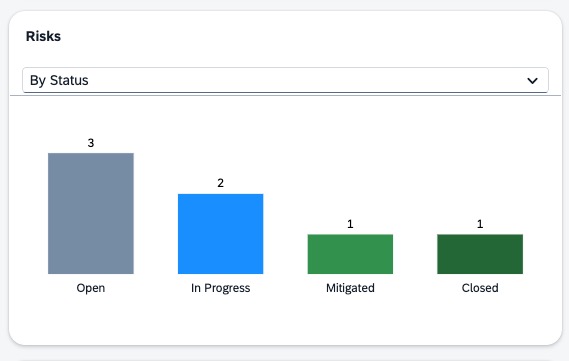
Project transparency has a new Risks card in the Project Overview app.
This card visualizes project risks in two ways by Status and by Risk Level – giving project managers and stakeholders an instant overview of potential challenges and their severity.
TL;DR:
The new Risks card in Project Overview provides instant visibility into project risks by status and level.
Grouping Projects into Programs – Projects and Setup
Users can now group multiple related projects under a Program, providing a higher-level organizational layer for complex initiatives.

Programs make it easier to navigate between connected projects, align their progress, and manage large-scale transformations more effectively.
TL;DR:
Group related projects into Programs for better portfolio visibility and easier navigation between linked initiatives.
Relations grouped in a single tab – Process Authoring
Relations in Process Authoring are now consolidated under a single Relations tab.
Users can quickly switch between relation types using a convenient drop-down menu, while still being able to scroll through sections as before.
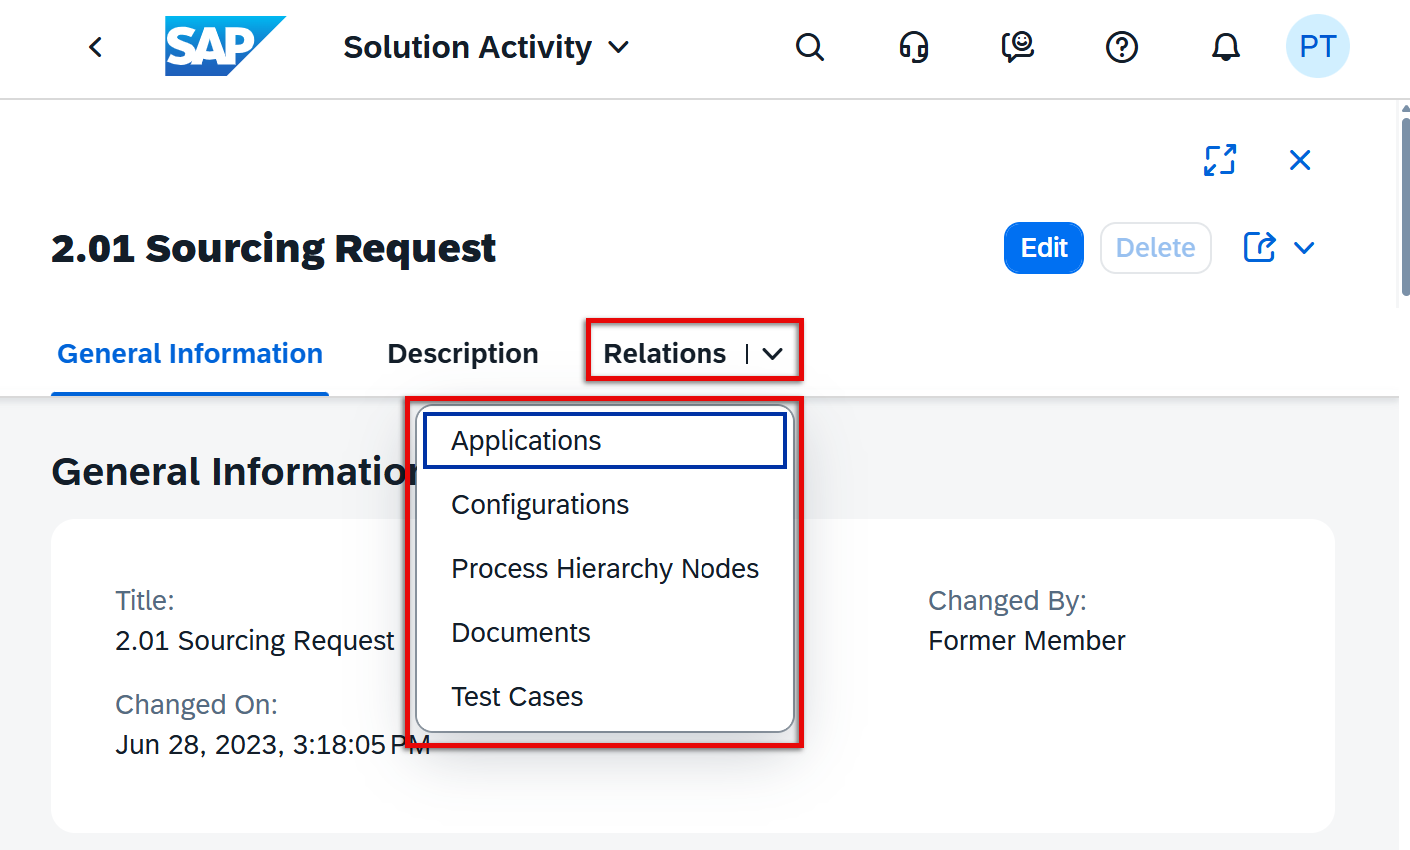
This usability improvement reduces clutter and simplifies navigation when managing multiple relation types in complex process structures.
TL;DR:
All relations for a solution activity are now grouped in one tab with a quick drop-down selector for smoother navigation.
Create Test Cases Directly in Processes
In the Processes app, users can now create test cases directly from a solution process or solution process flow diagram.
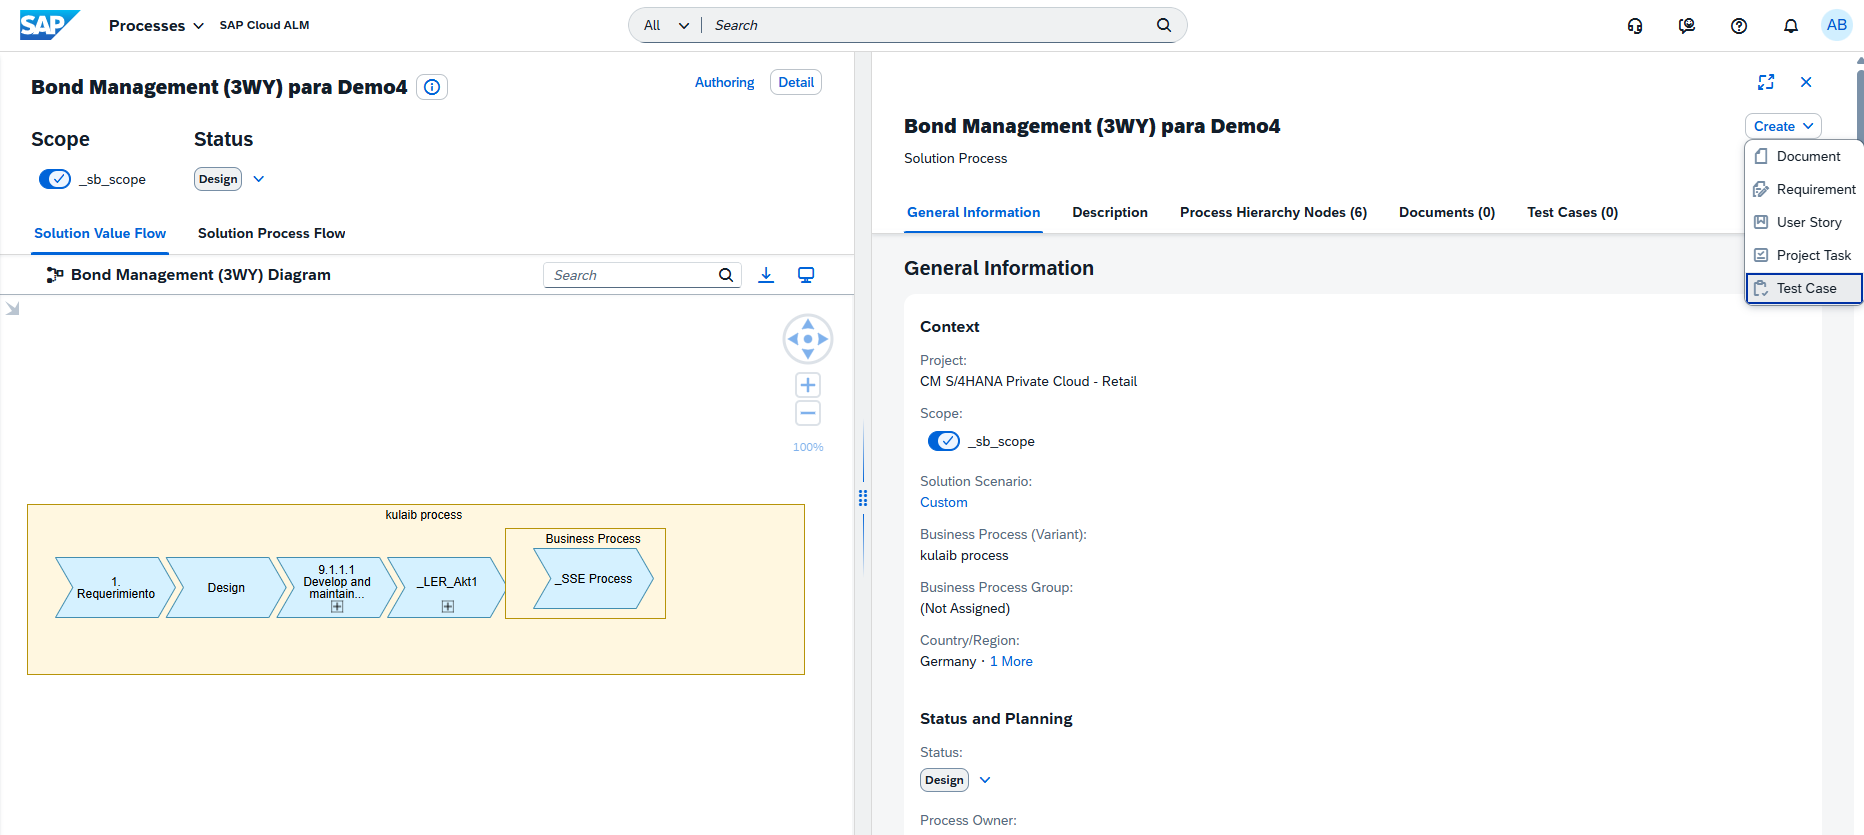
The creation dialog is prefilled with relevant data, so users only need to add a title before saving. Automated test cases can be created for solution processes, while manual ones can be added for process flow diagrams.
This reduces the need to switch between apps and helps maintain tighter alignment between processes and testing.
TL;DR:
Create automated or manual test cases directly in the Processes app – no need to switch to Test Preparation.