SAP Cloud ALM – What’s New in Week 38
SAP Cloud ALM continues to evolve with enhancements that improve AI-assisted monitoring, operational visibility, traceability, and usability across the platform.
The Week 38 release expands RISE with SAP Methodology with the new AI Assistance for Innovation Adoption app, while SAP Business Transformation Center improves troubleshooting and transformation model management. Service enhances issue and action processing, and Administration introduces new visibility into data collection health.
Implementation strengthens test management, transport handling, and job documentation, while Operations adds AI-assisted thresholds, dynamic monitoring capabilities, improved compliance checks, and broader service visibility.
Together, these updates provide greater automation, transparency, and efficiency across SAP Cloud ALM.
SAP Business Transformation Center – Data Management, Modeling
Enhanced Error Details for Failed Runs in Data Management
The Manage Runs app now provides more detailed error information when a run fails, making it easier to understand what caused an unsuccessful execution.
With the enhanced error handling, users can access additional error details directly for failed runs instead of relying only on the overall failure status. This provides more context for identifying the underlying problem and determining the appropriate corrective action.
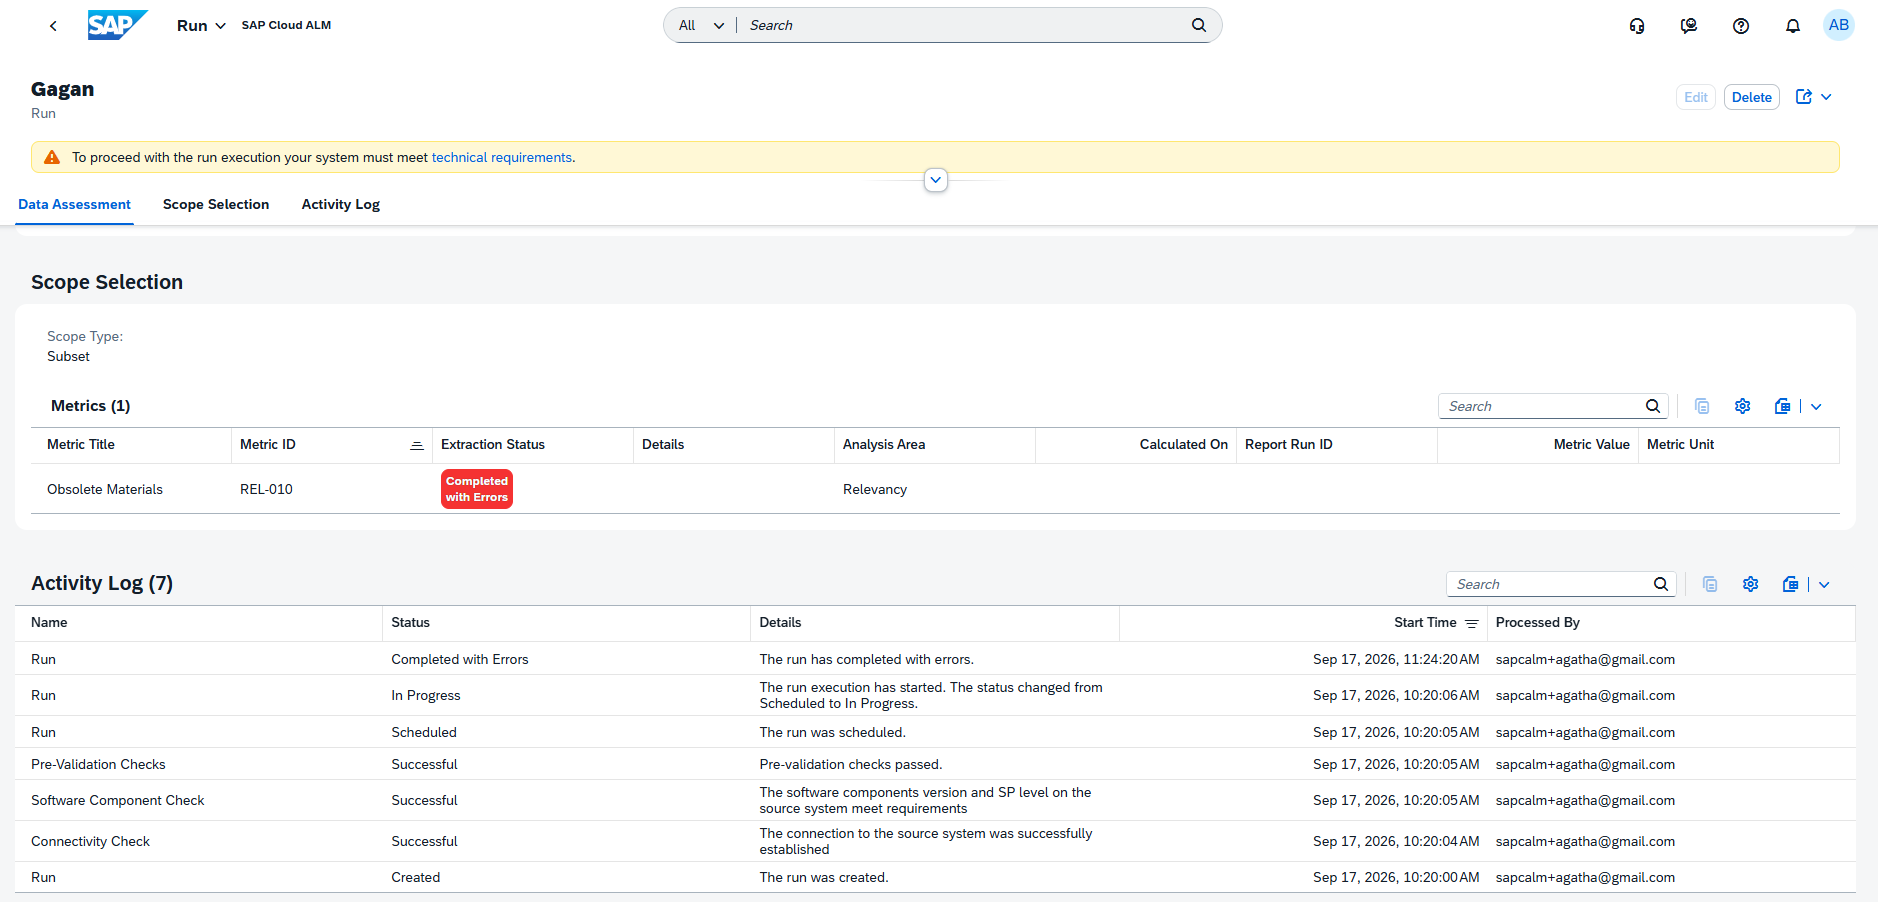
The enhancement improves troubleshooting within Data Management and can help reduce the time required to analyze and resolve failed transformation activities.
TL;DR:
The Manage Runs app now provides enhanced error details for failed runs, making failure causes easier to identify and troubleshoot.
Restart All Transformation Model Activities at Once in Modeling
The Transformation Model Readiness tab introduces a new Restart button that simplifies restarting transformation model activities.
Instead of restarting activities individually, users can now use the new action to restart all transformation model activities at once. This provides a more efficient way to reprocess the model when activities need to be executed again.
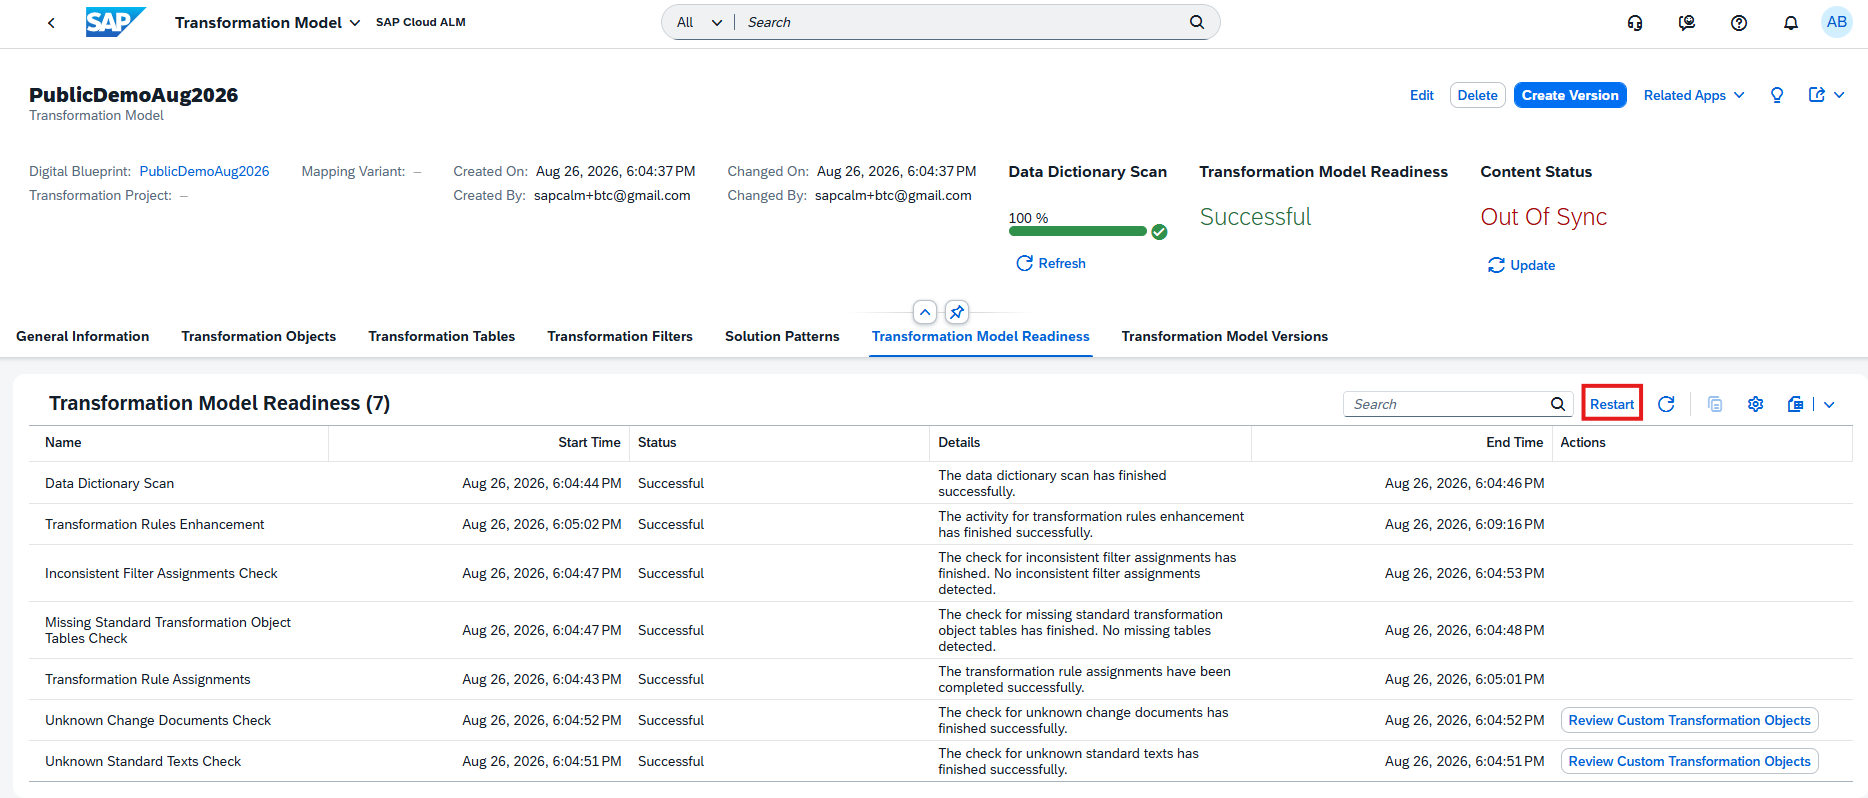
The enhancement simplifies transformation model management, particularly when multiple readiness activities need to be restarted following changes or corrections.
TL;DR:
A new Restart button in Transformation Model Readiness allows users to restart all transformation model activities at once, simplifying reprocessing and model management.
RISE with SAP Methodology – Several Apps
New AI Assistance for Innovation Adoption App
AI Assistance for Innovation Adoption app is now available under RISE with SAP Methodology on the SAP Cloud ALM launchpad.
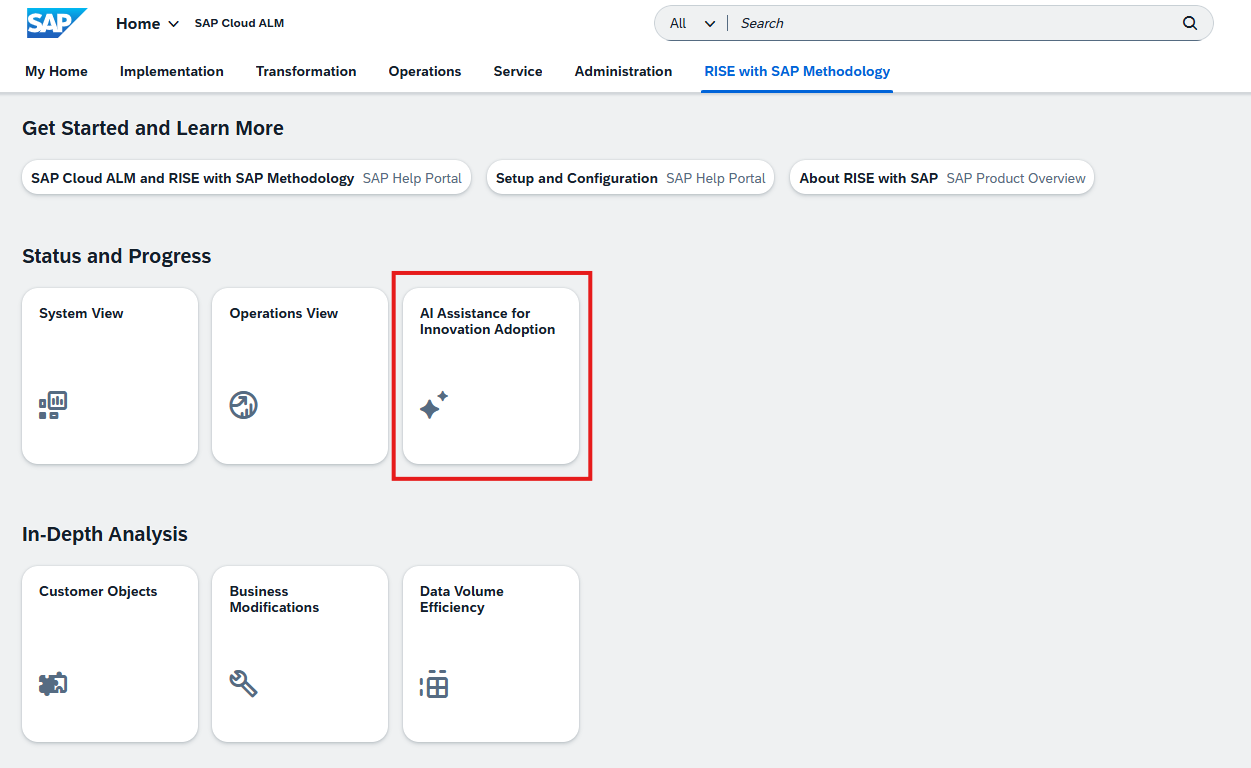
The app uses AI-assisted analysis to help organizations monitor, analyze, and identify improvement opportunities across their SAP landscape. The generated insights are presented through interactive dashboards, providing visibility into key performance indicators (KPIs), system insights, identified issues, and potential areas for improvement.
The app requires additional setup prerequisites before it can be enabled and displayed. The required configuration enables SAP Cloud ALM to extract the relevant data, generate insights, and provide automated recommendations.
TL;DR:
The AI Assistance for Innovation Adoption app is now available under the RISE with SAP Methodology page on the SAP Cloud ALM launchpad.
Implementation – Analytics, Documents, Features, Libraries, Test Execution, Test Preparation
Enhanced Test Execution and Defect Analysis
Analytics provides additional visibility into both defects and tester activities, making it easier to analyze testing progress and trace issues back to related features.
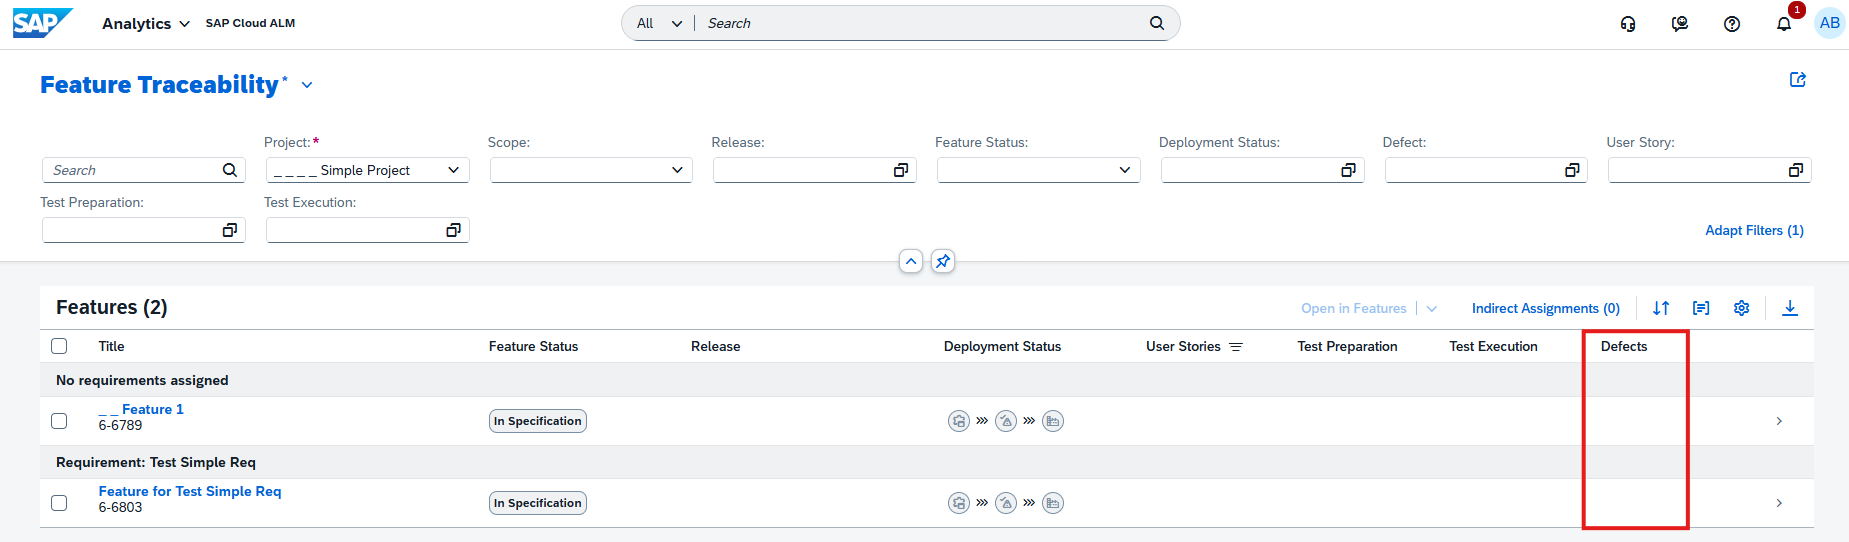
The Feature Traceability app now includes defects that are indirectly related to a feature through associated test executions and their test plans. Previously, the traceability view focused on direct relationships. Including these indirect relationships provides a more complete picture of defects connected to a feature and improves consistency across the Analytics apps.
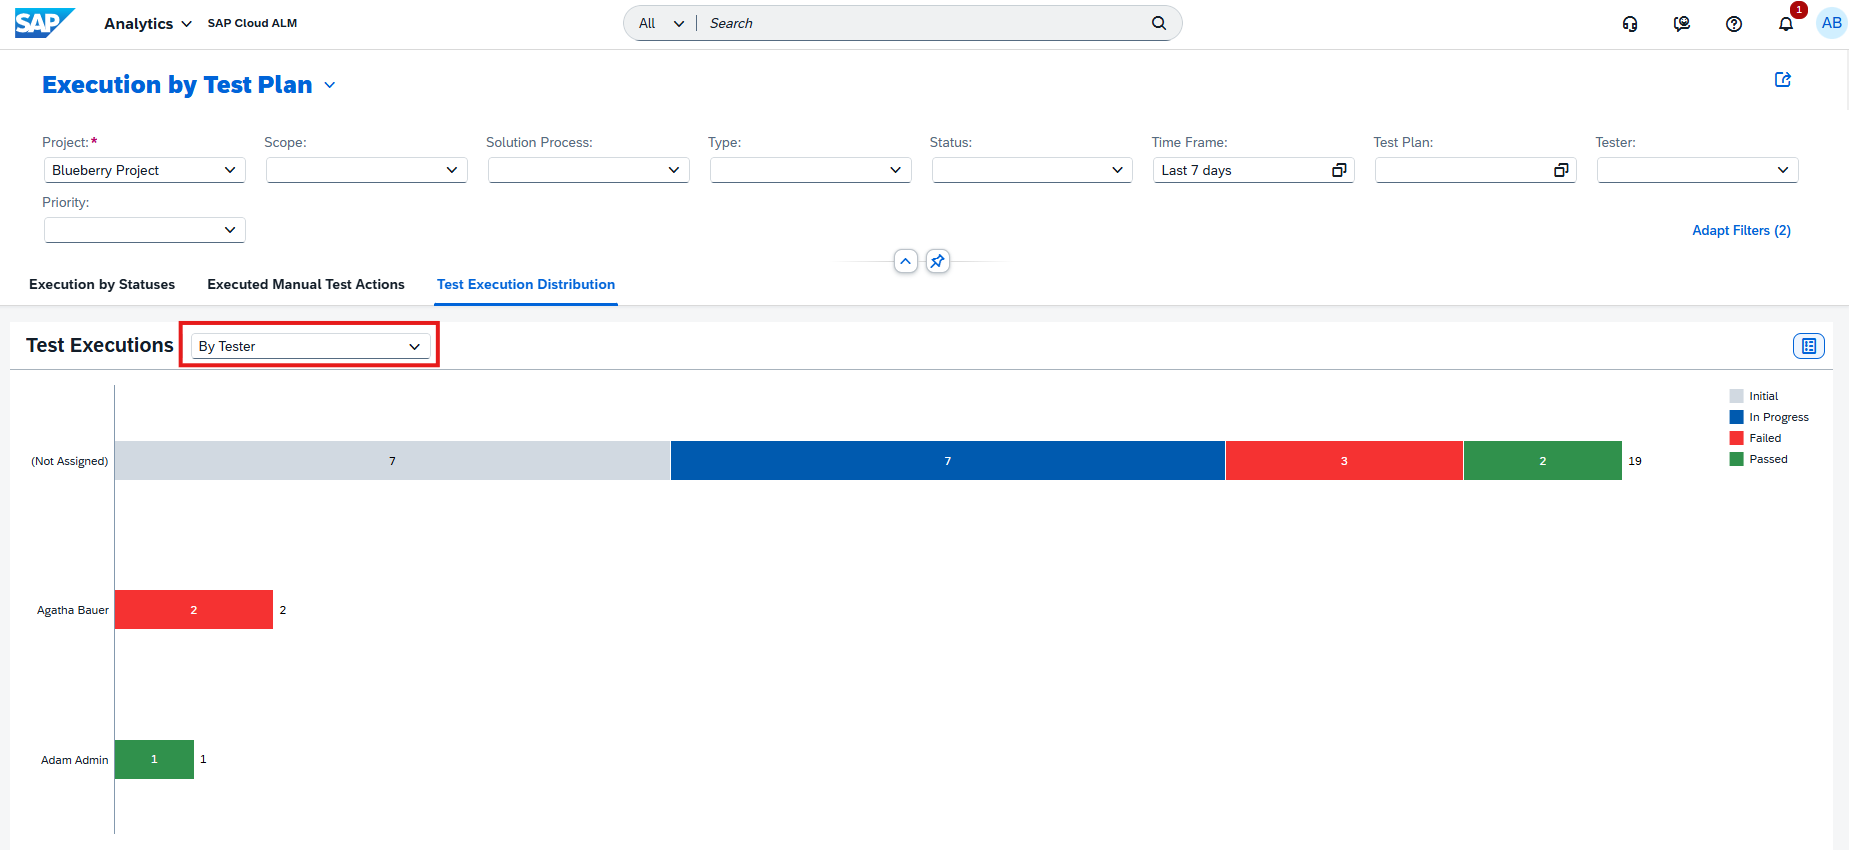
A new By Tester view is also available in both the Test Execution Analysis app and the Test Execution card in Project Overview. Test executions can therefore be grouped and analyzed according to the responsible tester, providing another perspective for tracking testing activities and progress.
TL;DR:
Analytics now provides more complete defect traceability through indirect assignments and a new By Tester view for analyzing test executions by tester.
Integration Between Job Documents and Job & Automation Monitoring
SAP Cloud ALM introduces a stronger connection between Job Documents and Job & Automation Monitoring, providing direct traceability between implementation documentation and monitored jobs.
A new Job Monitoring relation table is available for documents of type Job Document. It shows the assigned jobs together with information such as job name, job type, service, and status. Multiple Job Monitoring IDs can be associated with a single Job Document.
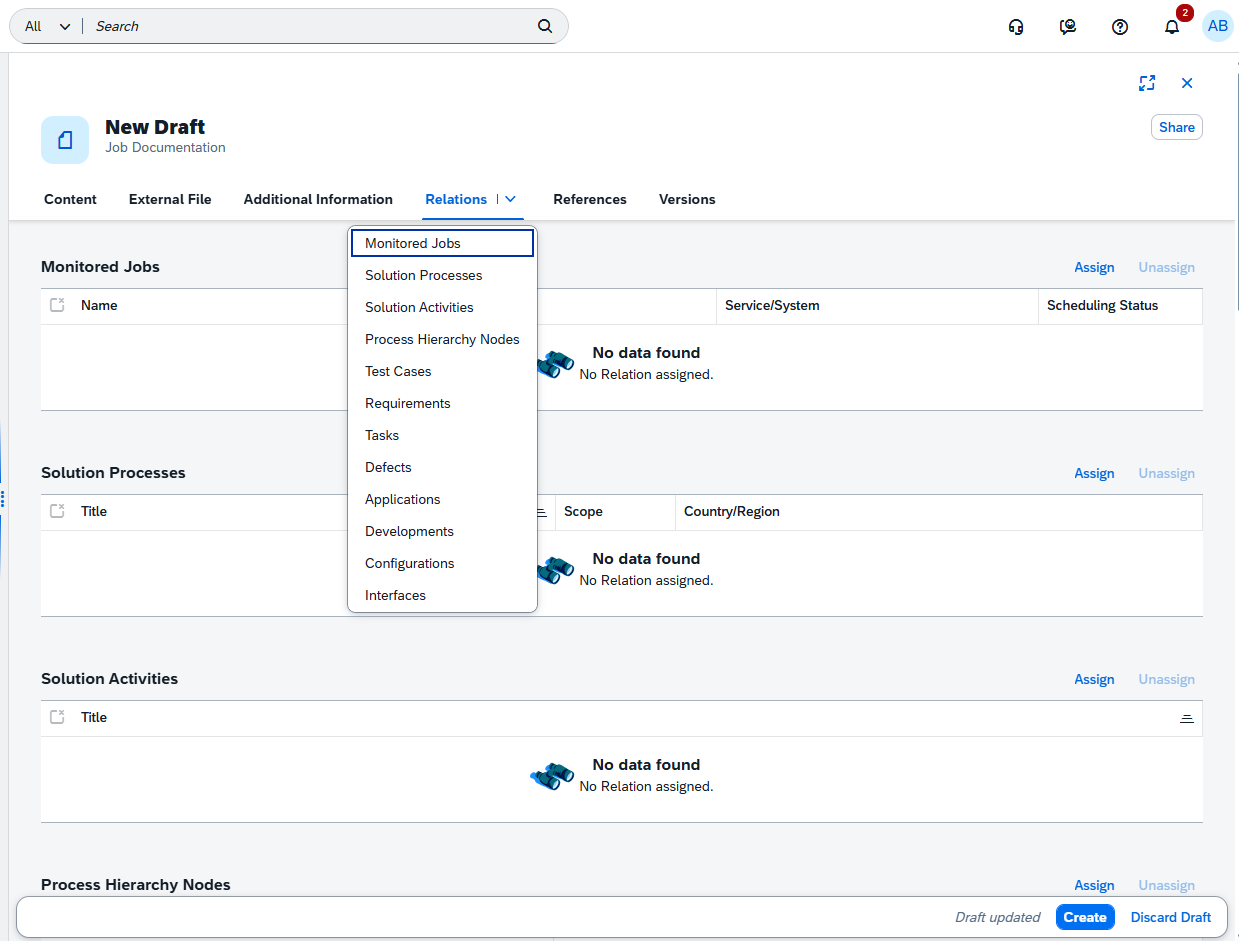
The integration also works directly from Job & Automation Monitoring, where users can create a new Job Document, assign an existing document, or remove an assignment. SAP Cloud ALM automatically maintains the relationship in both directions.
This makes it easier to connect operational job monitoring with the corresponding implementation documentation and maintain those relationships consistently.
TL;DR:
Job Documents can now be directly linked with jobs in Job & Automation Monitoring, with bidirectional relation management between the two applications.
Create and Assign ATO Transports
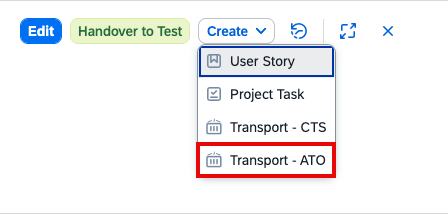
The Features app expands transport management capabilities for SAP S/4HANA Cloud Public Edition by supporting the creation and assignment of modifiable Adaptation Transport Organizer (ATO) transports.
Users can now create ATO transports and assign existing modifiable transports directly as part of feature management. If recently created or changed transports are not visible in the assignment dialog, the transport information can be synchronized using the Refresh function.
The functionality requires transport management for SAP S/4HANA Cloud Public Edition with ATO to be configured beforehand.
This enhancement strengthens the connection between feature implementation and transport management, allowing the related development changes and transports to be managed more closely together.
TL;DR:
The Features app now supports creating and assigning modifiable ATO transports for SAP S/4HANA Cloud Public Edition, improving integration between feature and transport management.
Deletion Status for Related Process Hierarchy Nodes
The Libraries app improves transparency for relations between library elements and Process Hierarchy Nodes.
A new Deletion Status column is available for Process Hierarchy Nodes in the Relations tab of library elements. When a related node has been deleted in the Process Hierarchy app, it is clearly marked with the status Deleted.
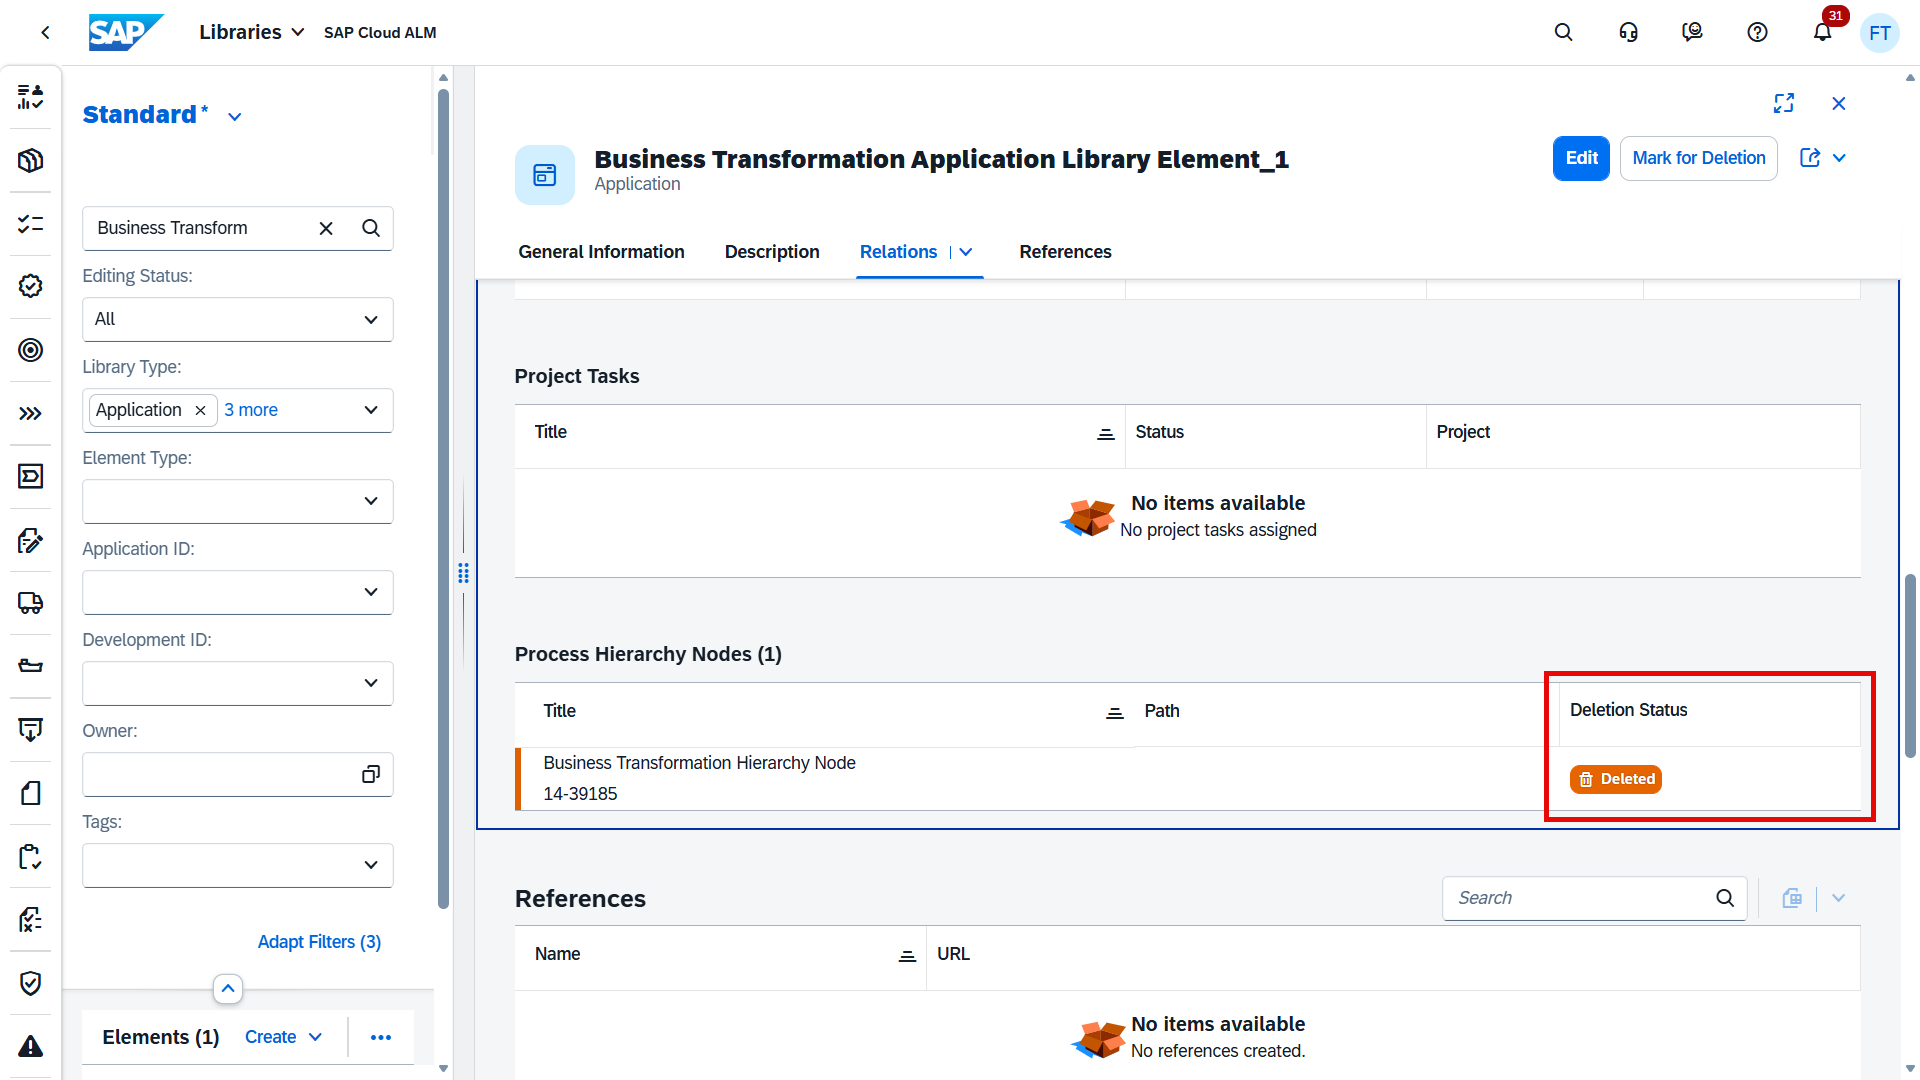
This makes it easier to identify obsolete relationships and prevents users from assuming that a referenced process hierarchy node is still active.
TL;DR:
Library elements now show the deletion status of related Process Hierarchy Nodes, making obsolete relationships easier to identify.
Improved Automated Test Synchronization and Manual Defect Handling
The Test Execution app introduces changes to both automated test synchronization and defect handling for manual tests.
Open automated test runs are now synchronized automatically with connected test automation providers. SAP Cloud ALM periodically retrieves updated execution statuses and test results, reducing the need for users to manually refresh test runs. Manual refresh remains available when an immediate update is required.
For manual test cases, defect actions have been removed from the Test Execution overview. Defects for manual tests are now managed from the corresponding test run, keeping defect handling within the context of the actual manual execution. Defect actions in the overview remain available for automated test cases.
Together, these changes streamline test execution by reducing manual synchronization effort and providing clearer handling of defects for manual and automated testing.
TL;DR:
Automated test runs now synchronize their status and results automatically, while defects for manual test cases are managed directly within the corresponding test run.
Select All for Automated Test Case Imports in Test Preparation
Importing automated test cases into SAP Cloud ALM is simplified with a new Select All option in the automated test case import list. After applying the required filters, users can select all test cases returned by the current filter criteria in a single step, rather than selecting each test case individually.
The option is available when the filtered result contains 100 or fewer test cases, making bulk imports of smaller and targeted test case sets considerably easier.
TL;DR:
A new Select All option allows users to select up to 100 filtered automated test cases at once when importing test cases.
Operations – Business Process Monitoring, Business Service Management, Configuration & Security Analysis – Validation, Health Monitoring, Job & Automation Monitoring, Real User Monitoring
Enhanced KPI Analysis, Navigation, and AI-Assisted Thresholds
Business Process Monitoring introduces several enhancements that make KPI configuration, analysis, and navigation more flexible and efficient.
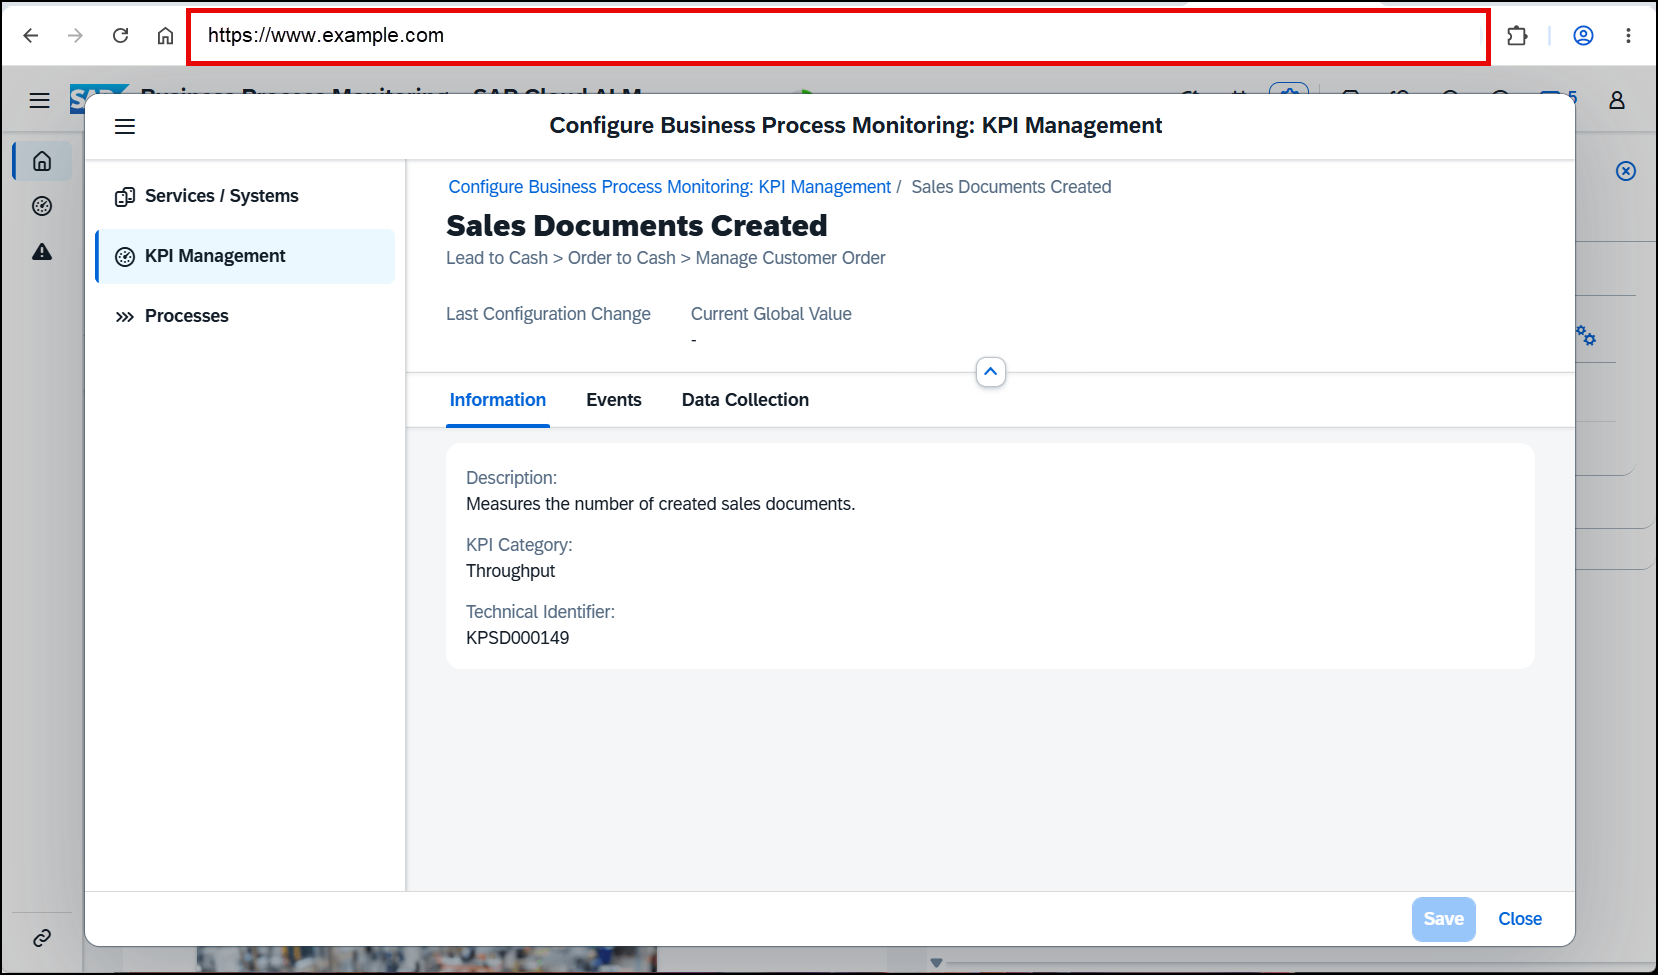
Navigation within the configuration area has been improved with support for direct links to specific subpages and subsections across Services / Systems, KPI Management, and Processes. Users can reuse the browser URL to return directly to a particular configuration location, making frequently used settings easier to access.
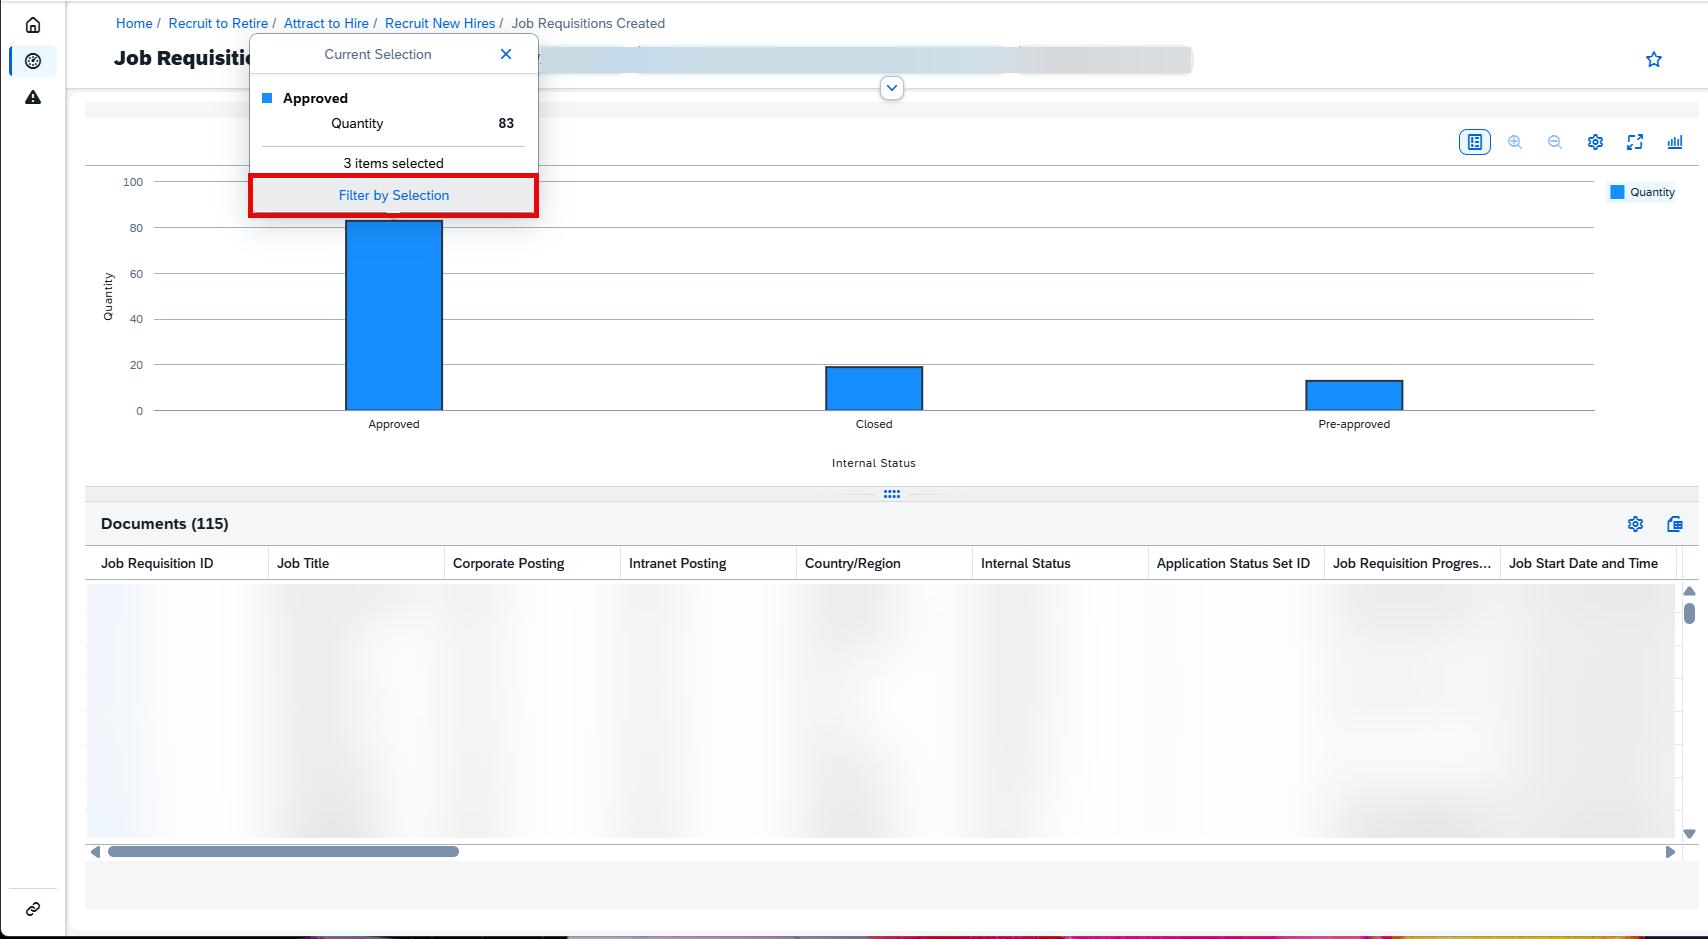
On the Monitoring page, users can now select one or multiple data points in a chart and choose Filter by Selection. The selected values are then used to filter both the chart and the related Documents table, providing a faster way to focus on specific monitoring data.
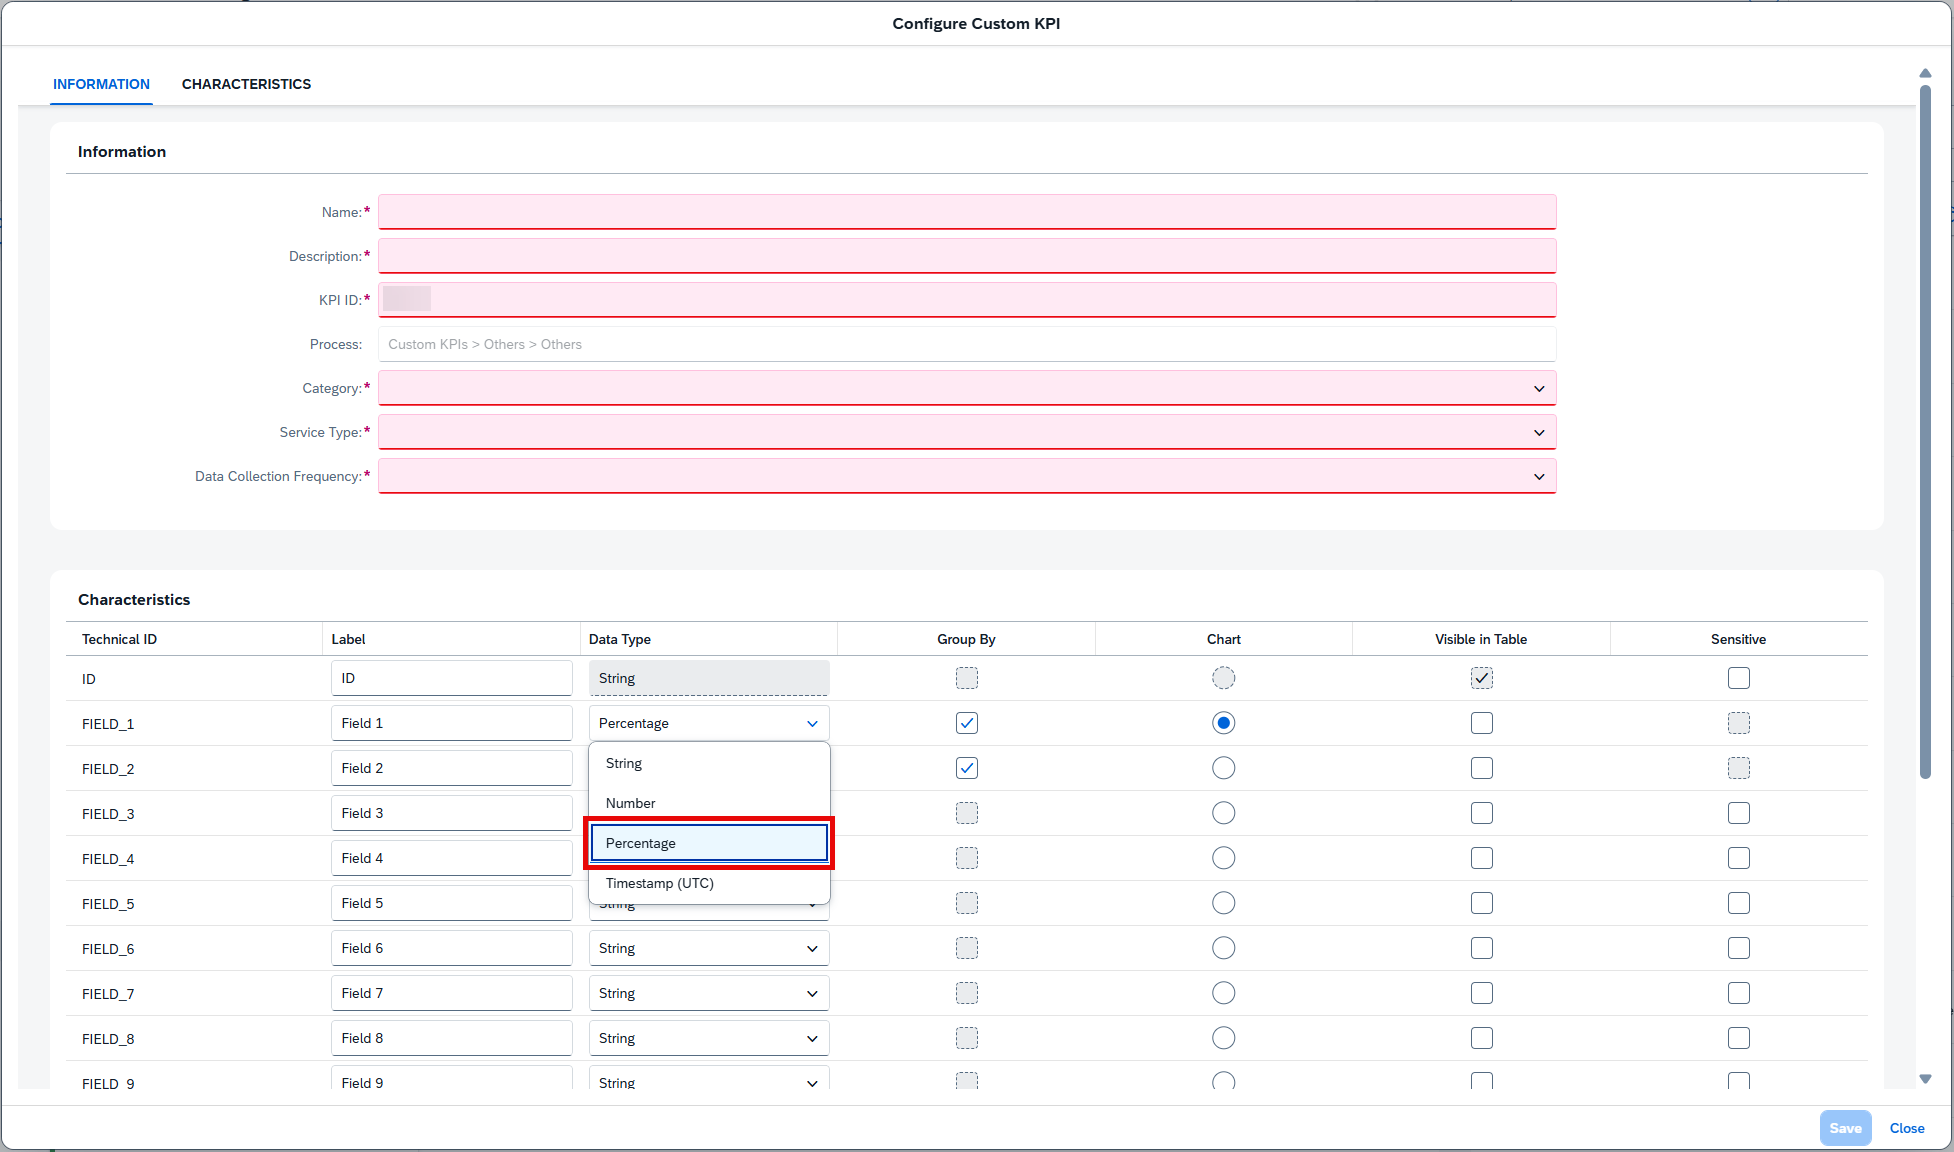
KPI visualization has also been expanded with percentage-based data. Custom KPIs can use Percentage as a data type, while KPI results can be displayed as pie charts with percentages, providing a more intuitive view of proportional monitoring data.
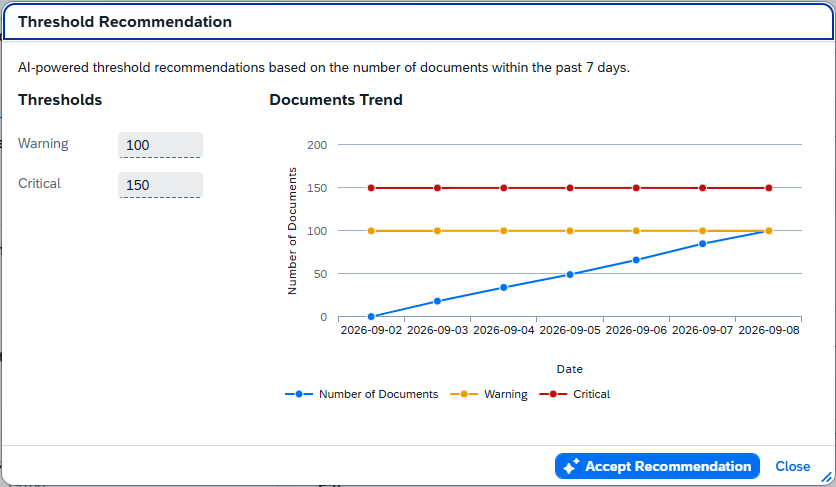
A significant addition is the introduction of AI-powered threshold recommendations. SAP Cloud ALM can analyze document volumes from the past seven days and recommend threshold values for KPI events. Recommendations can be reviewed before being accepted and are available when sufficient monitoring data exists. When filters are used, only fields configured as Group By influence the recommendation calculation.
Together, these improvements make Business Process Monitoring easier to navigate and analyze while introducing AI assistance for defining more data-informed monitoring thresholds.
TL;DR:
Business Process Monitoring adds direct configuration links, chart-based filtering, percentage KPIs and pie charts, and AI-powered threshold recommendations, improving both KPI analysis and monitoring configuration.
Expanded SAP Cloud ERP Public Service and Event Visibility
Business Service Management expands its integration with SAP Cloud ERP public, providing additional visibility into both business services and service degradation events.
Degradation Events detected by SAP for SAP Cloud ERP public are now displayed in the Event Calendar. Event Actions such as email notifications, chat notifications, and tickers can be configured for these events, allowing teams to be proactively informed about service degradation. Service Level Reporting and Service Level Objectives do not apply to these events.
In addition, Workforce Management integrations created as part of SAP Cloud ERP public are now represented as Business Services in Business Service Management. These services can be added to the monitoring scope and their events displayed in the Event Calendar. SAP-managed Status Events and SPC Events are supported, while Custom Events are not available.
TL;DR:
Business Service Management expands SAP Cloud ERP public visibility with Degradation Events in the Event Calendar and support for Workforce Management integrations as Business Services.
More Flexible Scoping and Date-Based Rules for Custom Checks
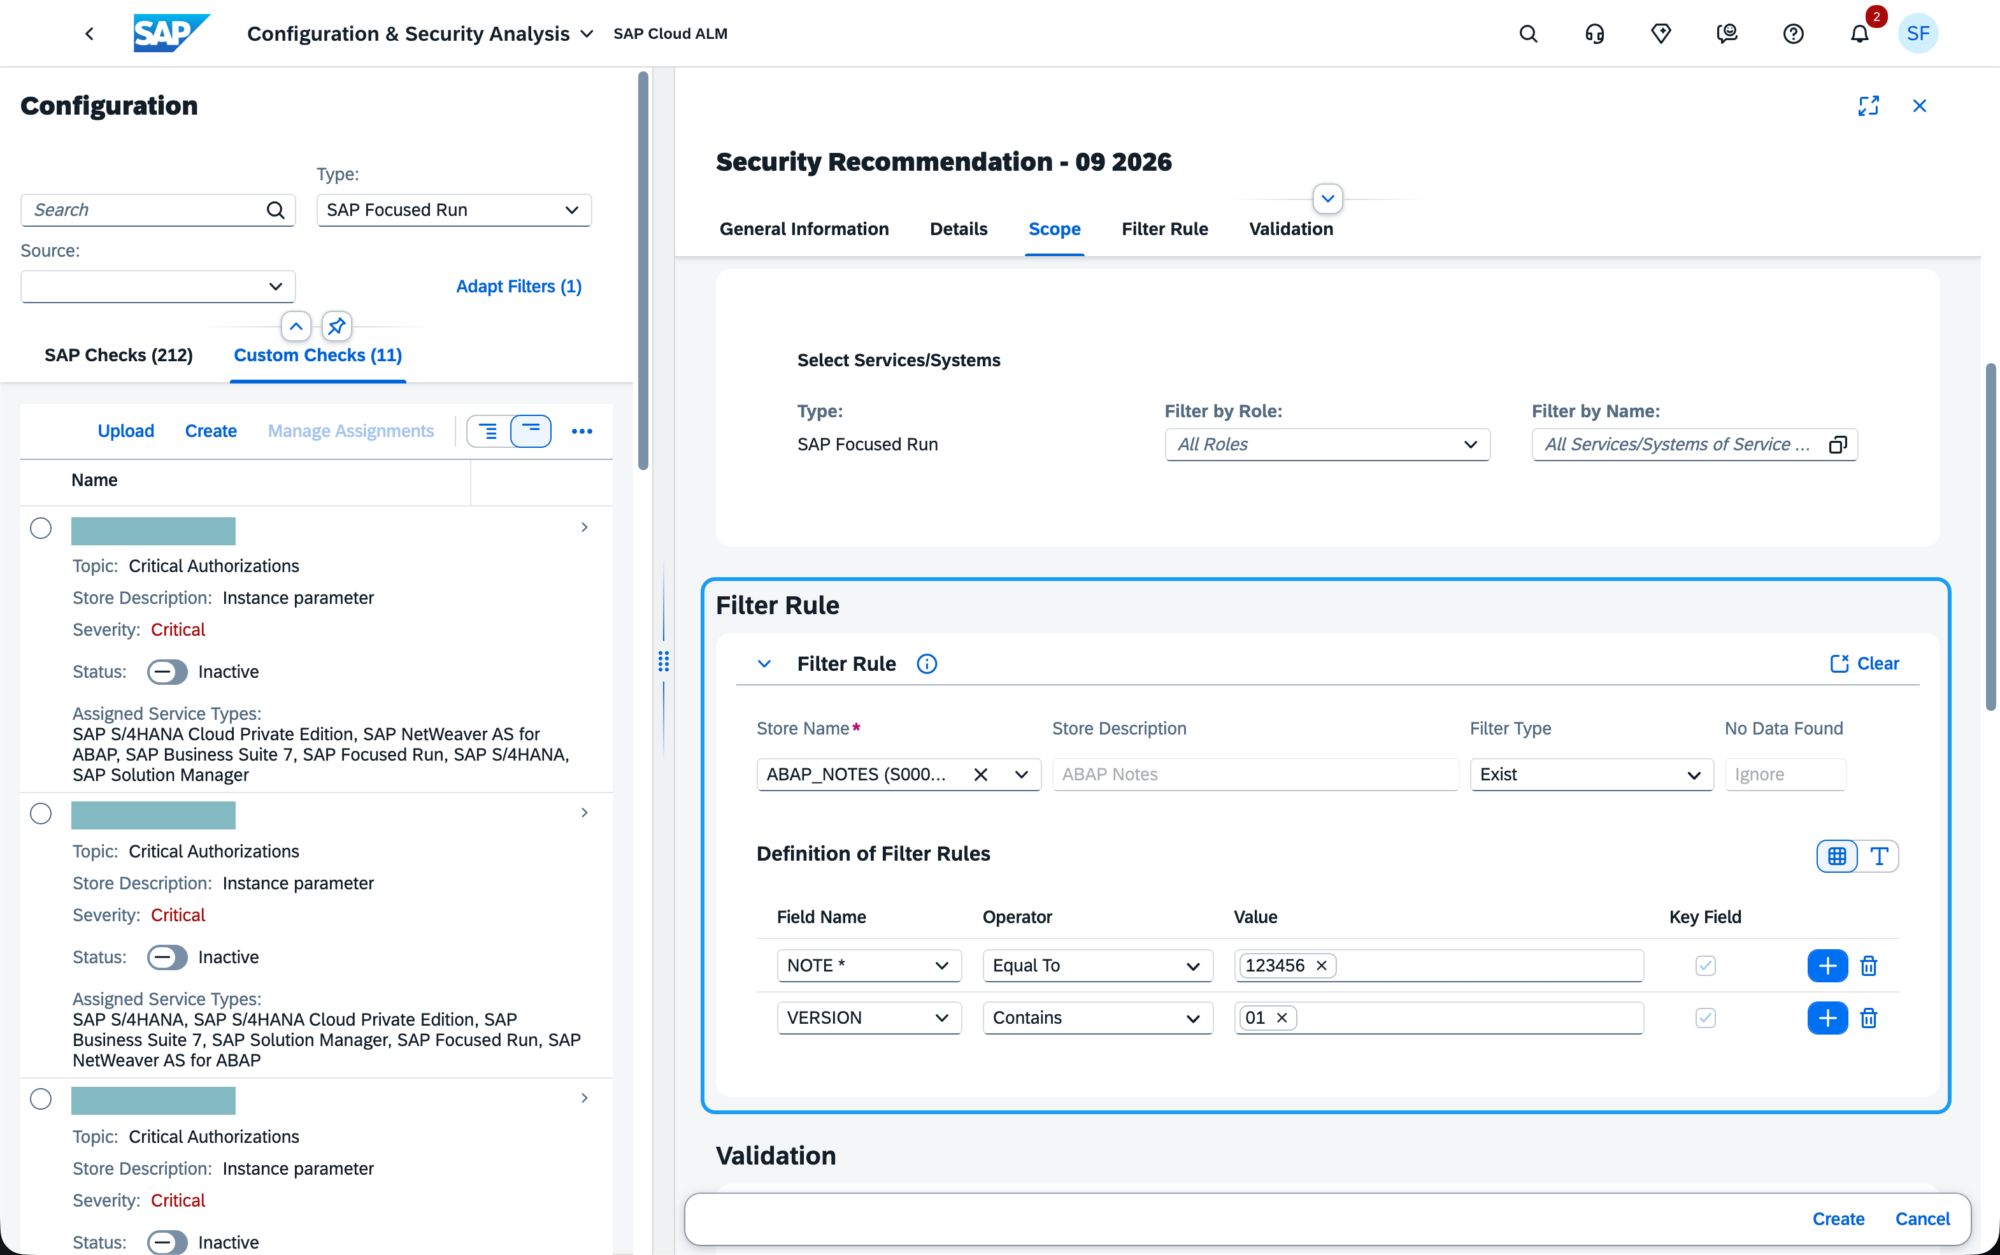
Configuration & Security Analysis introduces additional flexibility for defining Custom Checks, both in determining which service instances should be evaluated and in creating date-based validation logic.
A new Filter Rules section allows users to control which service instances are included in a Custom Check. A filter rule combines a data store, filter type, and filter values. Only service instances matching the configured criteria are validated, while the remaining instances are excluded from the check scope.
Validation rules also gain two new date-oriented operators: Less Than Days Ago and More Than Days Ahead. These can be used in compliance and non-compliance rules for date fields such as RELEASE_DATE and INITIAL_RELEASE_DATE.
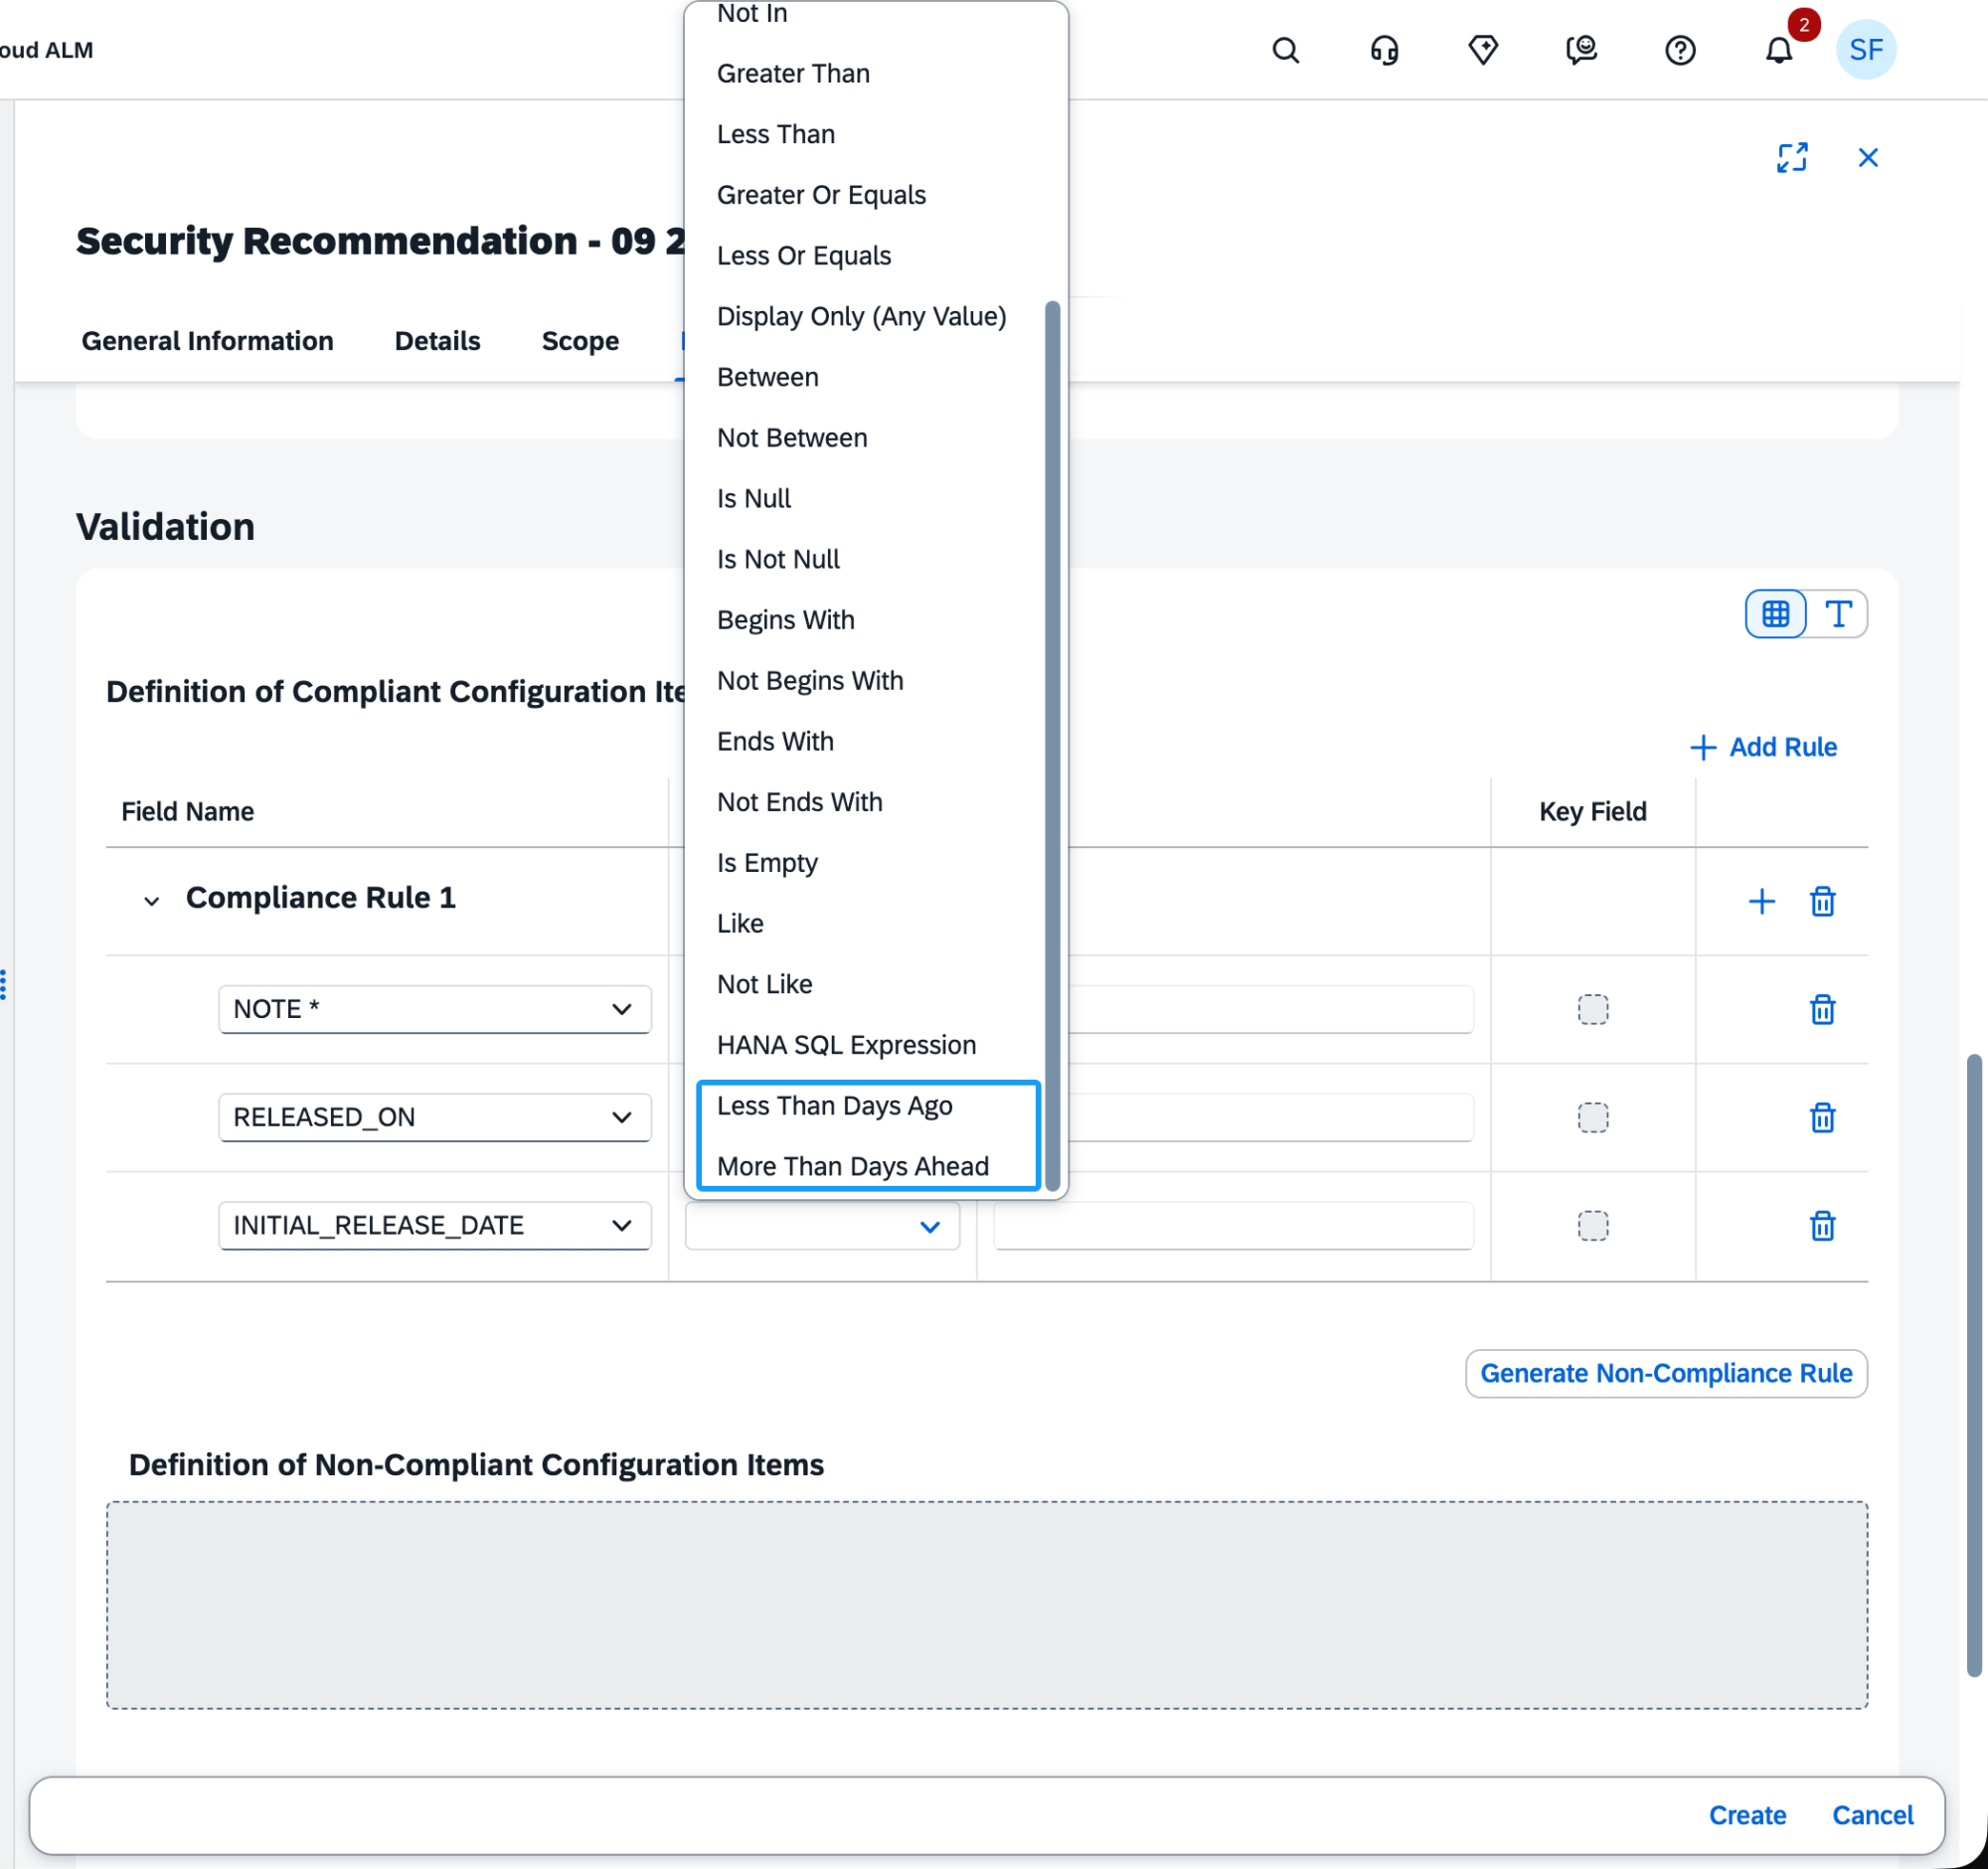
Together, these enhancements allow Custom Checks to be targeted more precisely and make it easier to define compliance requirements based on the age of or time remaining until configuration-related dates.
TL;DR:
Custom Checks now support service-instance Filter Rules and new date-based validation operators, enabling more targeted and flexible compliance checks.
Dynamic Thresholds and New Document Management Service Metrics
Health Monitoring introduces enhancements that improve both adaptive performance monitoring and visibility into SAP Document Management Service (DMS) instances.
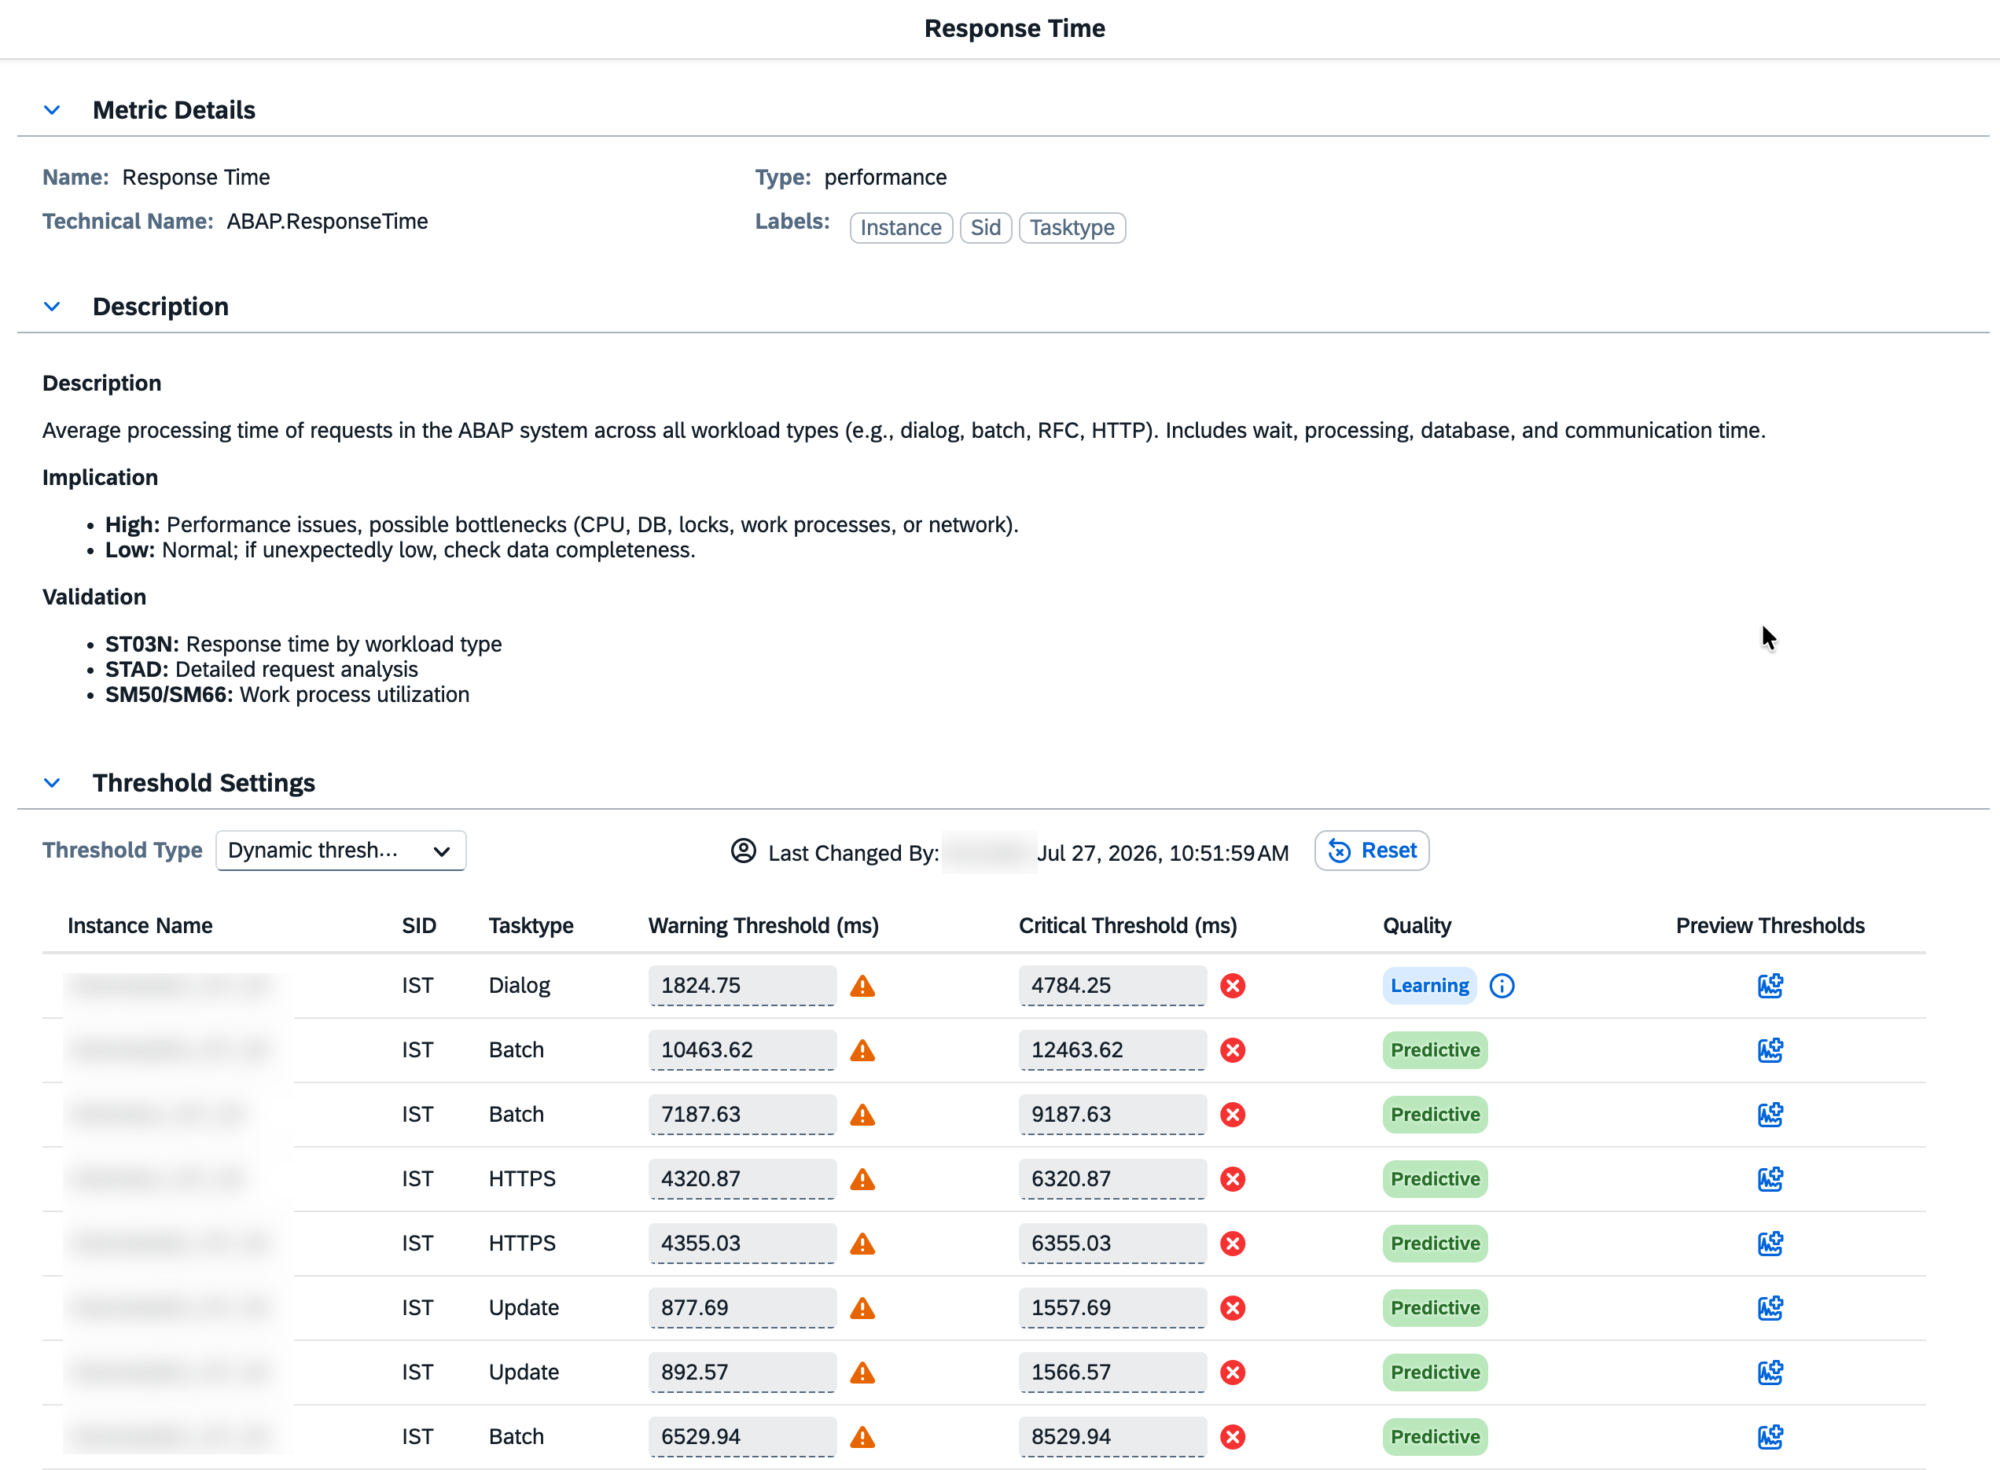
A major addition is Dynamic Thresholds, which automatically calculate performance thresholds based on historical data and trend analysis. Instead of relying only on manually configured static limits, Health Monitoring learns the normal behavior of a metric and can identify deviations that may indicate emerging performance issues. This can help reduce manual configuration and unnecessary alerts while making monitoring more responsive to actual system behavior.
Dynamic Thresholds require sufficient historical data for learning. The Quality column indicates the current state using four classifications:
- Predictive when the model is actively generating thresholds
- Static when metric behavior is too constant for reliable prediction
- Learning while additional data is being collected
- Insufficient when there is not enough suitable data for predictive modeling
Health Monitoring also expands coverage for Document Management Service with three new metrics: Active Repositories, Repositories Pending Permanent Deletion, and Total Storage Used. These provide visibility into repository availability, repositories awaiting permanent removal, and overall storage consumption within a DMS service instance.
Together, these enhancements provide more adaptive performance monitoring while expanding the range of SAP services that can be observed through Health Monitoring.
TL;DR:
Health Monitoring introduces Dynamic Thresholds based on historical metric behavior and new DMS metrics for active repositories, pending deletions, and storage usage, improving both proactive monitoring and service visibility.
Map Monitored Jobs and Automations to Job Documents
Job & Automation Monitoring introduces direct integration with Job Documents, strengthening the connection between operational monitoring and implementation documentation.
From the Job Definitions page, users can now assign or unassign a Job Document for a monitored job or automation. This allows the relevant job documentation to be accessed and managed directly in the context of the monitored object.
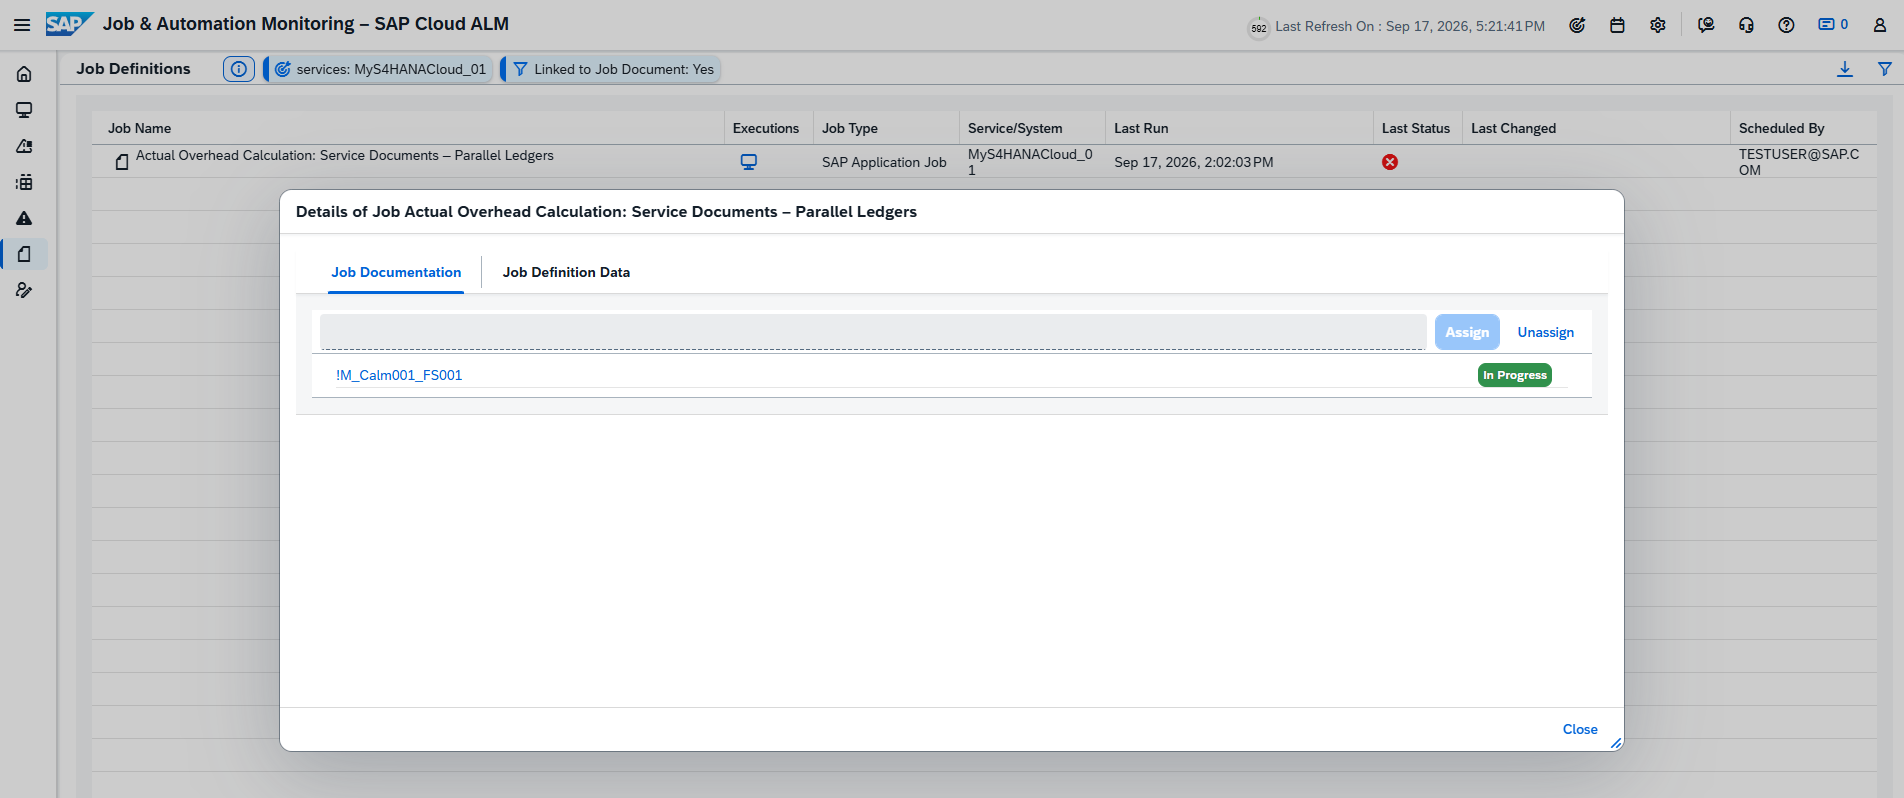
This complements the new Implementation Documents functionality introduced in the same release, where Job Documents display their associated monitored jobs and maintain the relationship in both directions.
TL;DR:
Monitored jobs and automations can now be mapped directly to Job Documents, providing better traceability between operational monitoring and job documentation.
Suppress Alerts for Predictable Seasonal Change Points
Real User Monitoring improves anomaly alerting by allowing users to suppress alerts for change points caused by predictable seasonal patterns.
Patterns such as weekly usage peaks or quarter-end spikes can naturally produce significant changes in monitored behavior without necessarily representing a problem. These known seasonal changes can now be suppressed so that they do not continuously generate unnecessary alerts.
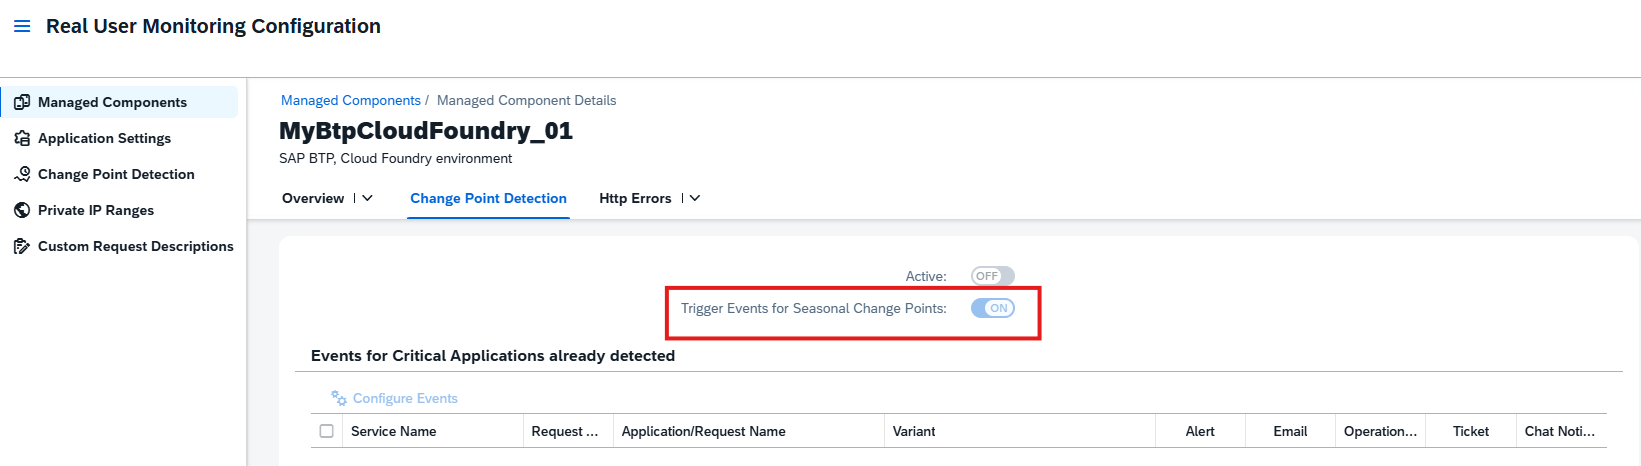
This helps reduce alert noise and allows monitoring teams to focus more attention on unexpected deviations and anomalies that may require investigation.
TL;DR:
Real User Monitoring can now suppress alerts for predictable seasonal change points, reducing alert noise and keeping attention on unexpected anomalies.
Service – Issues and Actions Management
Enhanced Issue and Action Details Pages
The Issue and Action details pages receive several usability and workflow enhancements, allowing users to manage issues and standalone actions more efficiently from a single place.
Users can now navigate directly to the previous or next issue or standalone action from the details page. This makes it easier to review multiple items in sequence without returning to the Manage Issues or Manage Standalone Actions lists after each item.

Additional actions are also available directly from the details pages. Users can now create follow-up tasks or forward an issue or standalone action to an external system, such as Jira or ServiceNow, without navigating back to the corresponding list page.

A new Customer and Service Information tab provides additional context, including the customer’s go-live date and, where applicable, information about the assigned Service, Session, and Customer Contact. The tab also provides External Issue Tracking information, including links to the external system an item was forwarded to and associated follow-up tasks when available.
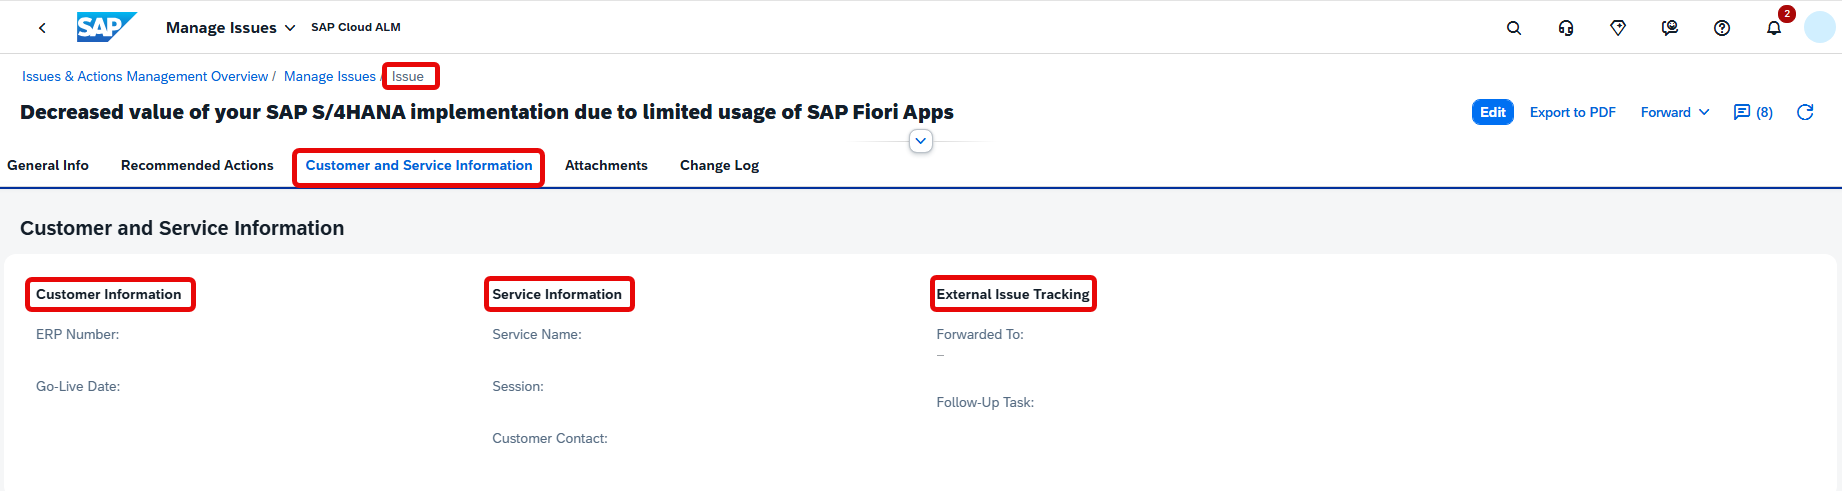
Together, these improvements make the details pages a more complete workspace for reviewing, navigating, and processing issues and actions.
TL;DR:
Issue and Action details pages now support previous/next navigation, follow-up task creation, forwarding to external systems, and additional customer, service, and external tracking information.
Administration – Self-Monitoring
New Data Collection Metric
The Self-Monitoring app introduces a new Data Collection metric, providing administrators with centralized visibility into the runtime data collection status of managed components across SAP Cloud ALM applications.
The new Data Collection card shows the overall data collection health of the tenant as a percentage, calculated based on the number of services with active data collection compared with all configured services. It also shows the number of services in Active and Error states and highlights the top five services based on runtime status and criticality. The view can be categorized by Service Type or Application.
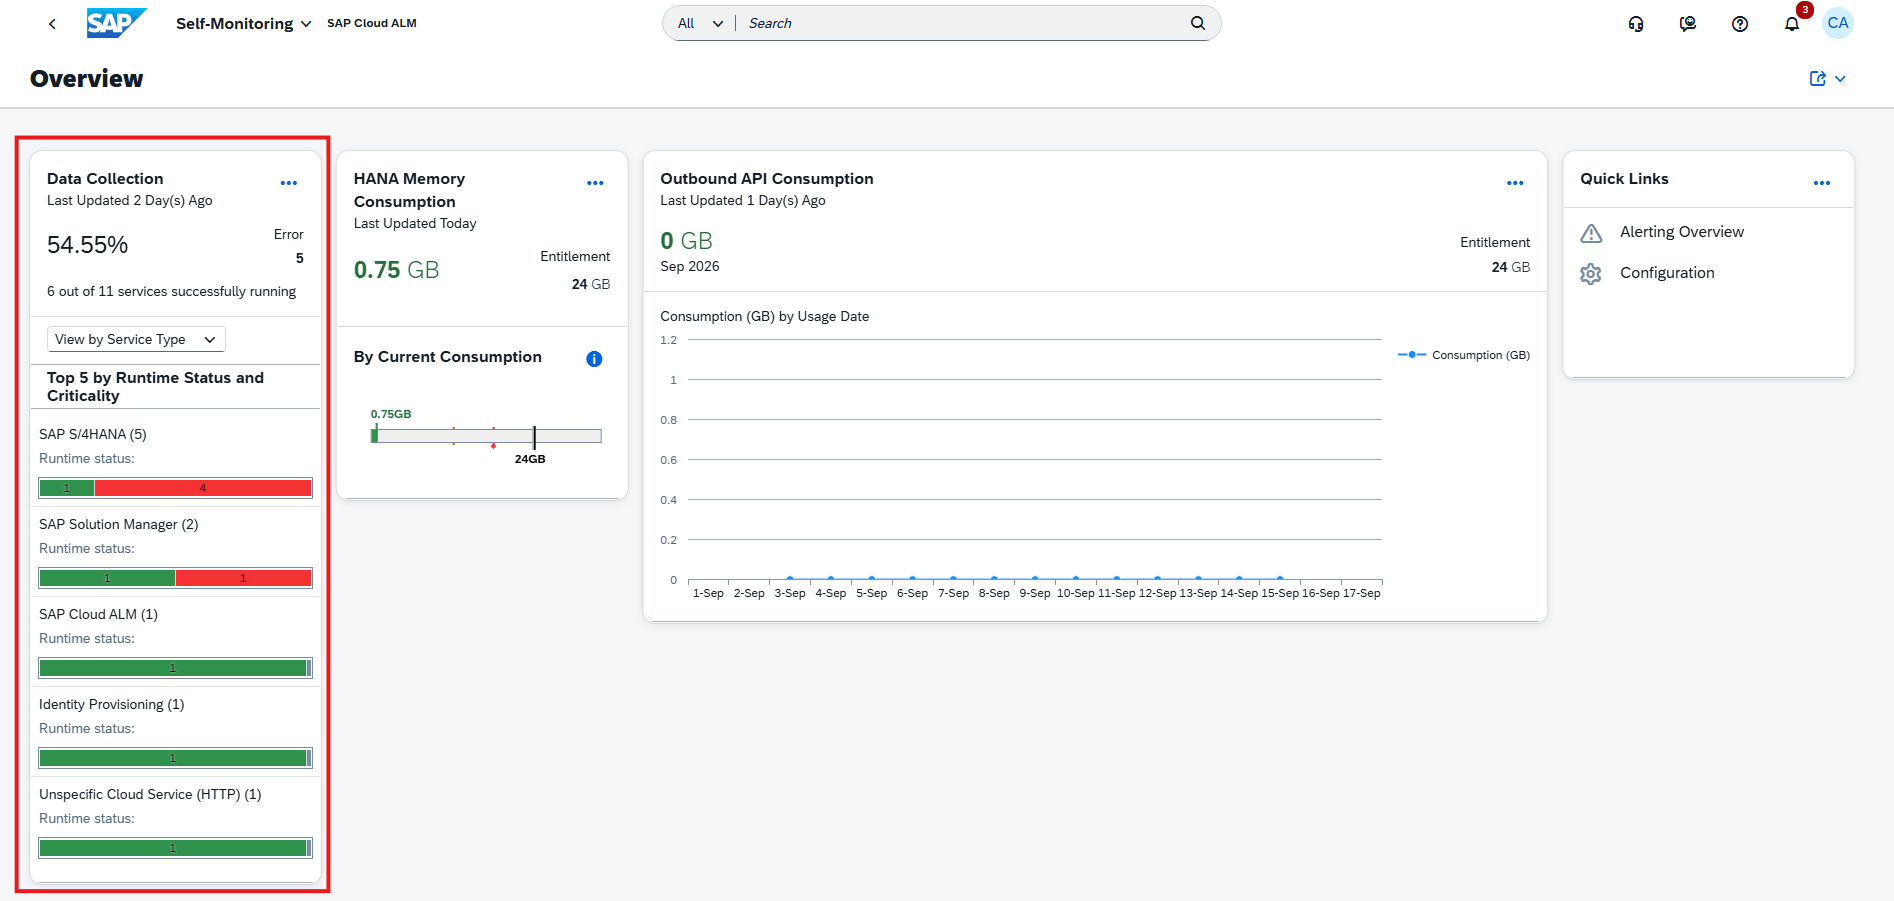
For more detailed analysis, administrators can open the Data Collection Details view to see all configured services and their current collection status. The information includes the associated SAP Cloud ALM application, runtime status, monitored capabilities, and the service’s status over the last 30 minutes. Data collection history is available for the last three hours, helping determine whether collection problems are temporary or recurring.
The details view also provides Classic and Visual filters, with filtering options such as Service Name, Runtime Status, Application, and Service Type. This makes it easier to narrow down collection problems to a specific application, service, or type of managed component.
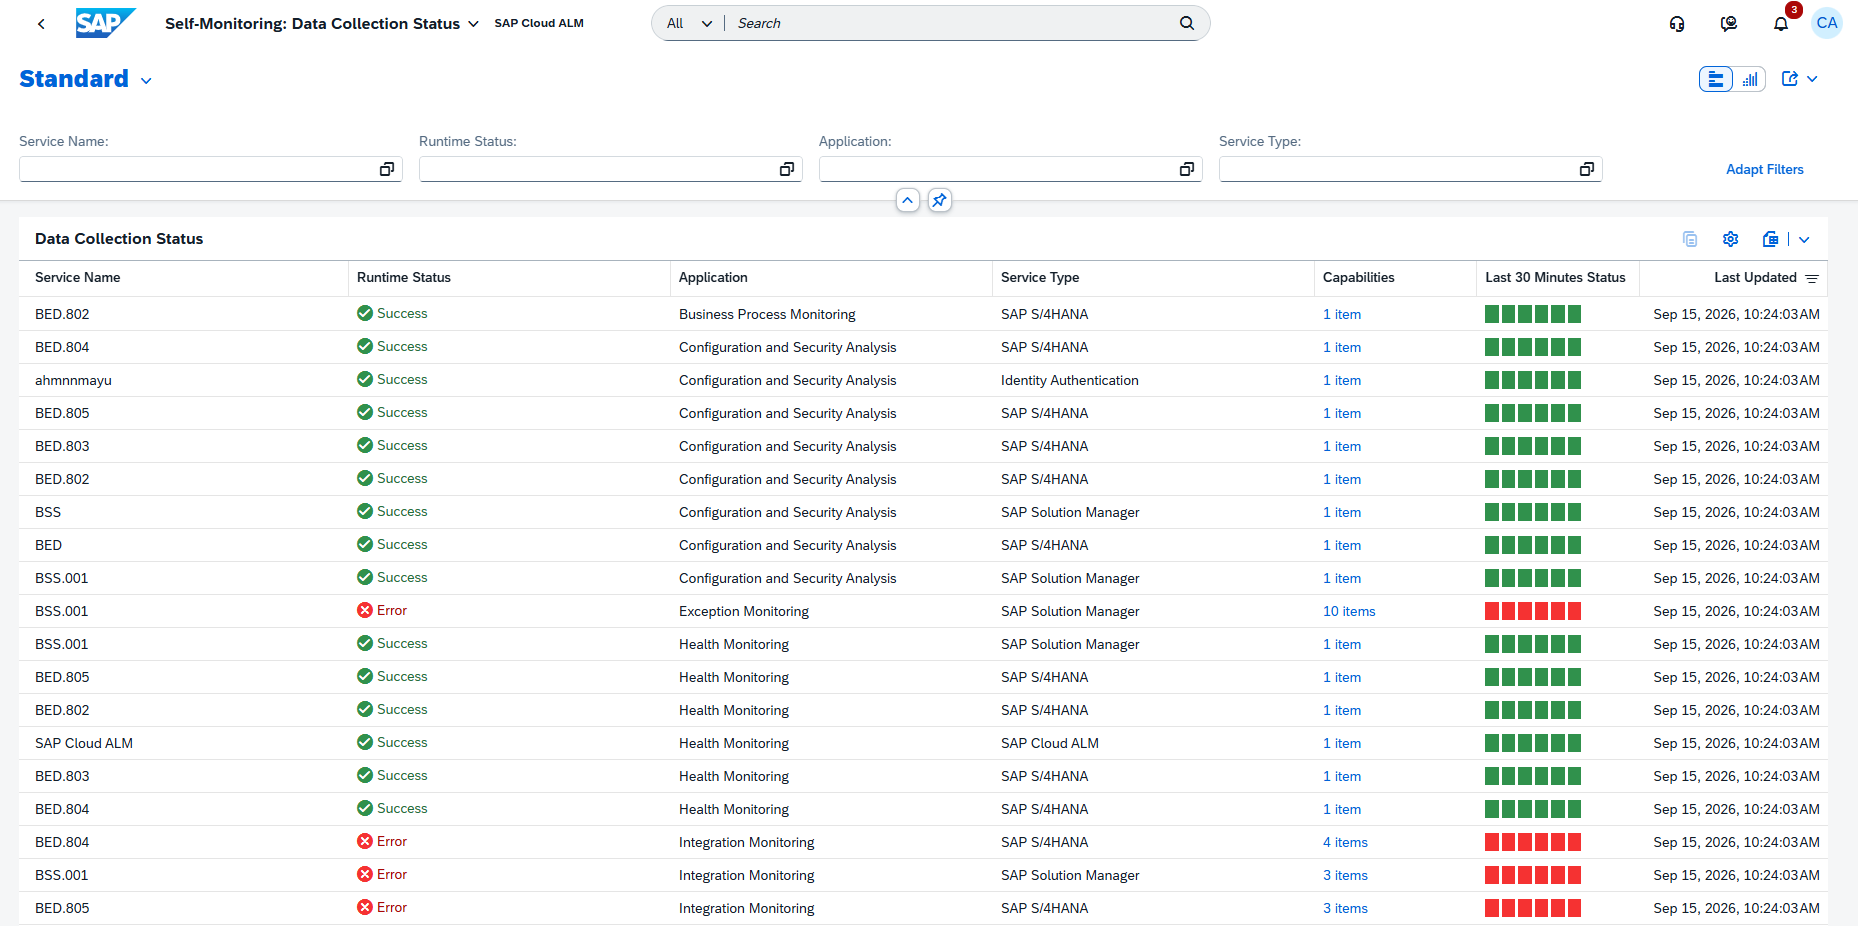
Overall, the new metric provides a dedicated starting point for identifying and investigating data collection issues before they affect monitoring visibility in SAP Cloud ALM.
TL;DR:
The new Data Collection metric provides an overview of data collection health and allows administrators to analyze individual collection instances and their status history.