This time, our blog series “How to ALM ” (HTALM) is about the possibilities of modeling and documenting ALM processes directly in SAP Cloud ALM (CALM). We show how to “activate” the predefined ALM best practice flows in SAP Cloud ALM and then customize them.
❓ Why document ALM processes in SAP Cloud ALM?
The predefined best practices in SAP Cloud ALM already provide a clear structure for onboarding, project setup, build, test and deployment. Nevertheless, every organization has individual requirements for IT processes that make it necessary to adapt the processes. And here’s the best part: you can adapt and document the best practice processes directly in SAP Cloud ALM BPMN Modeler.
⚽️ ALM Kick-start Modeling
SAP Cloud ALM comes with detailed BPMN process diagrams for the following areas:
Onboarding
Projektsetup
Fit-to-Standard
Build
Test
Deployment
Fix & Enhance
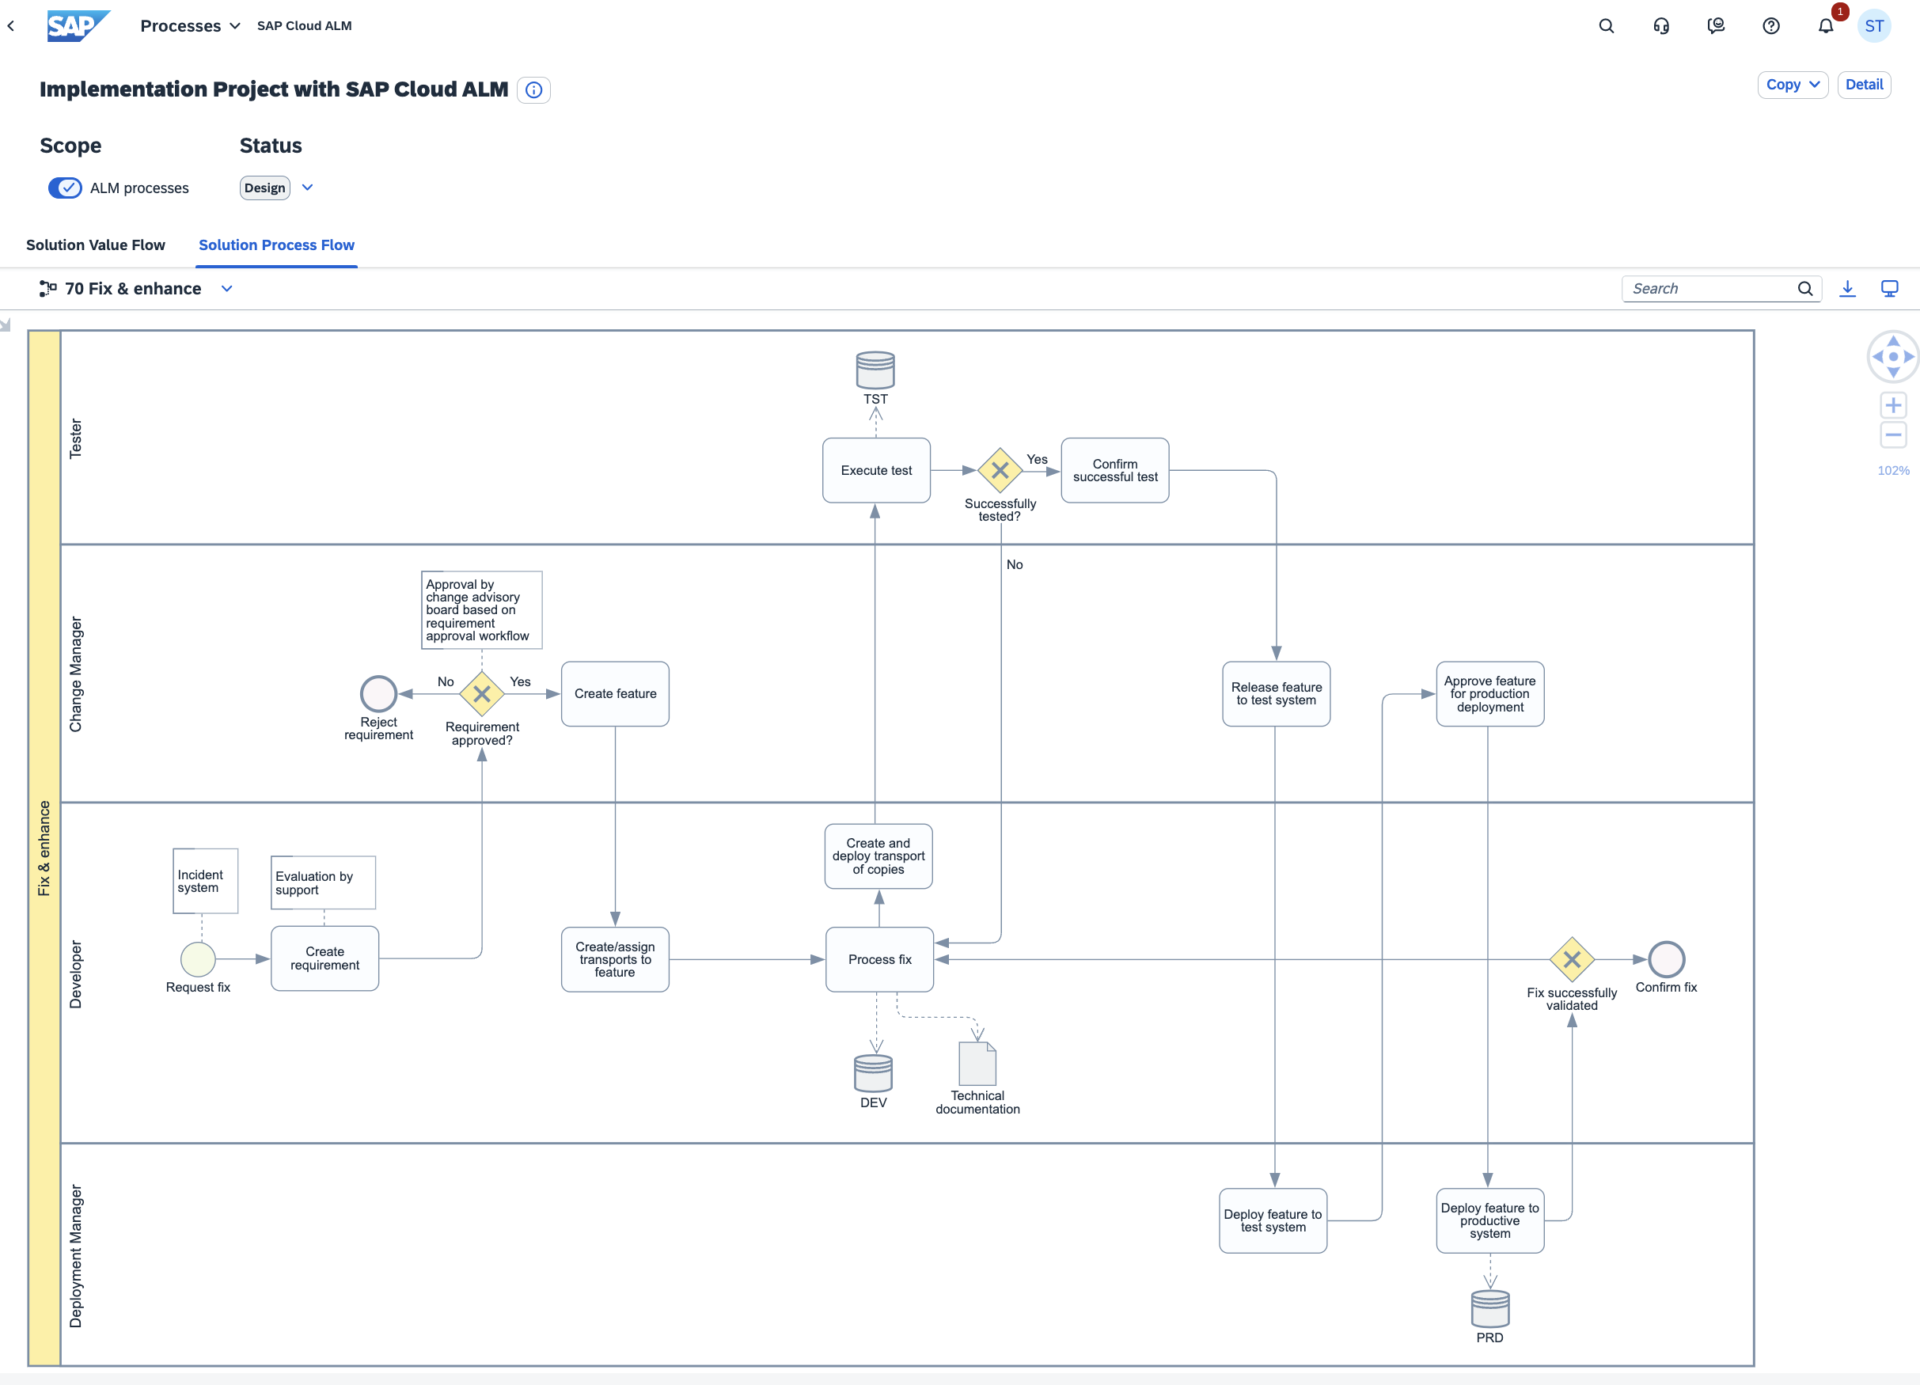
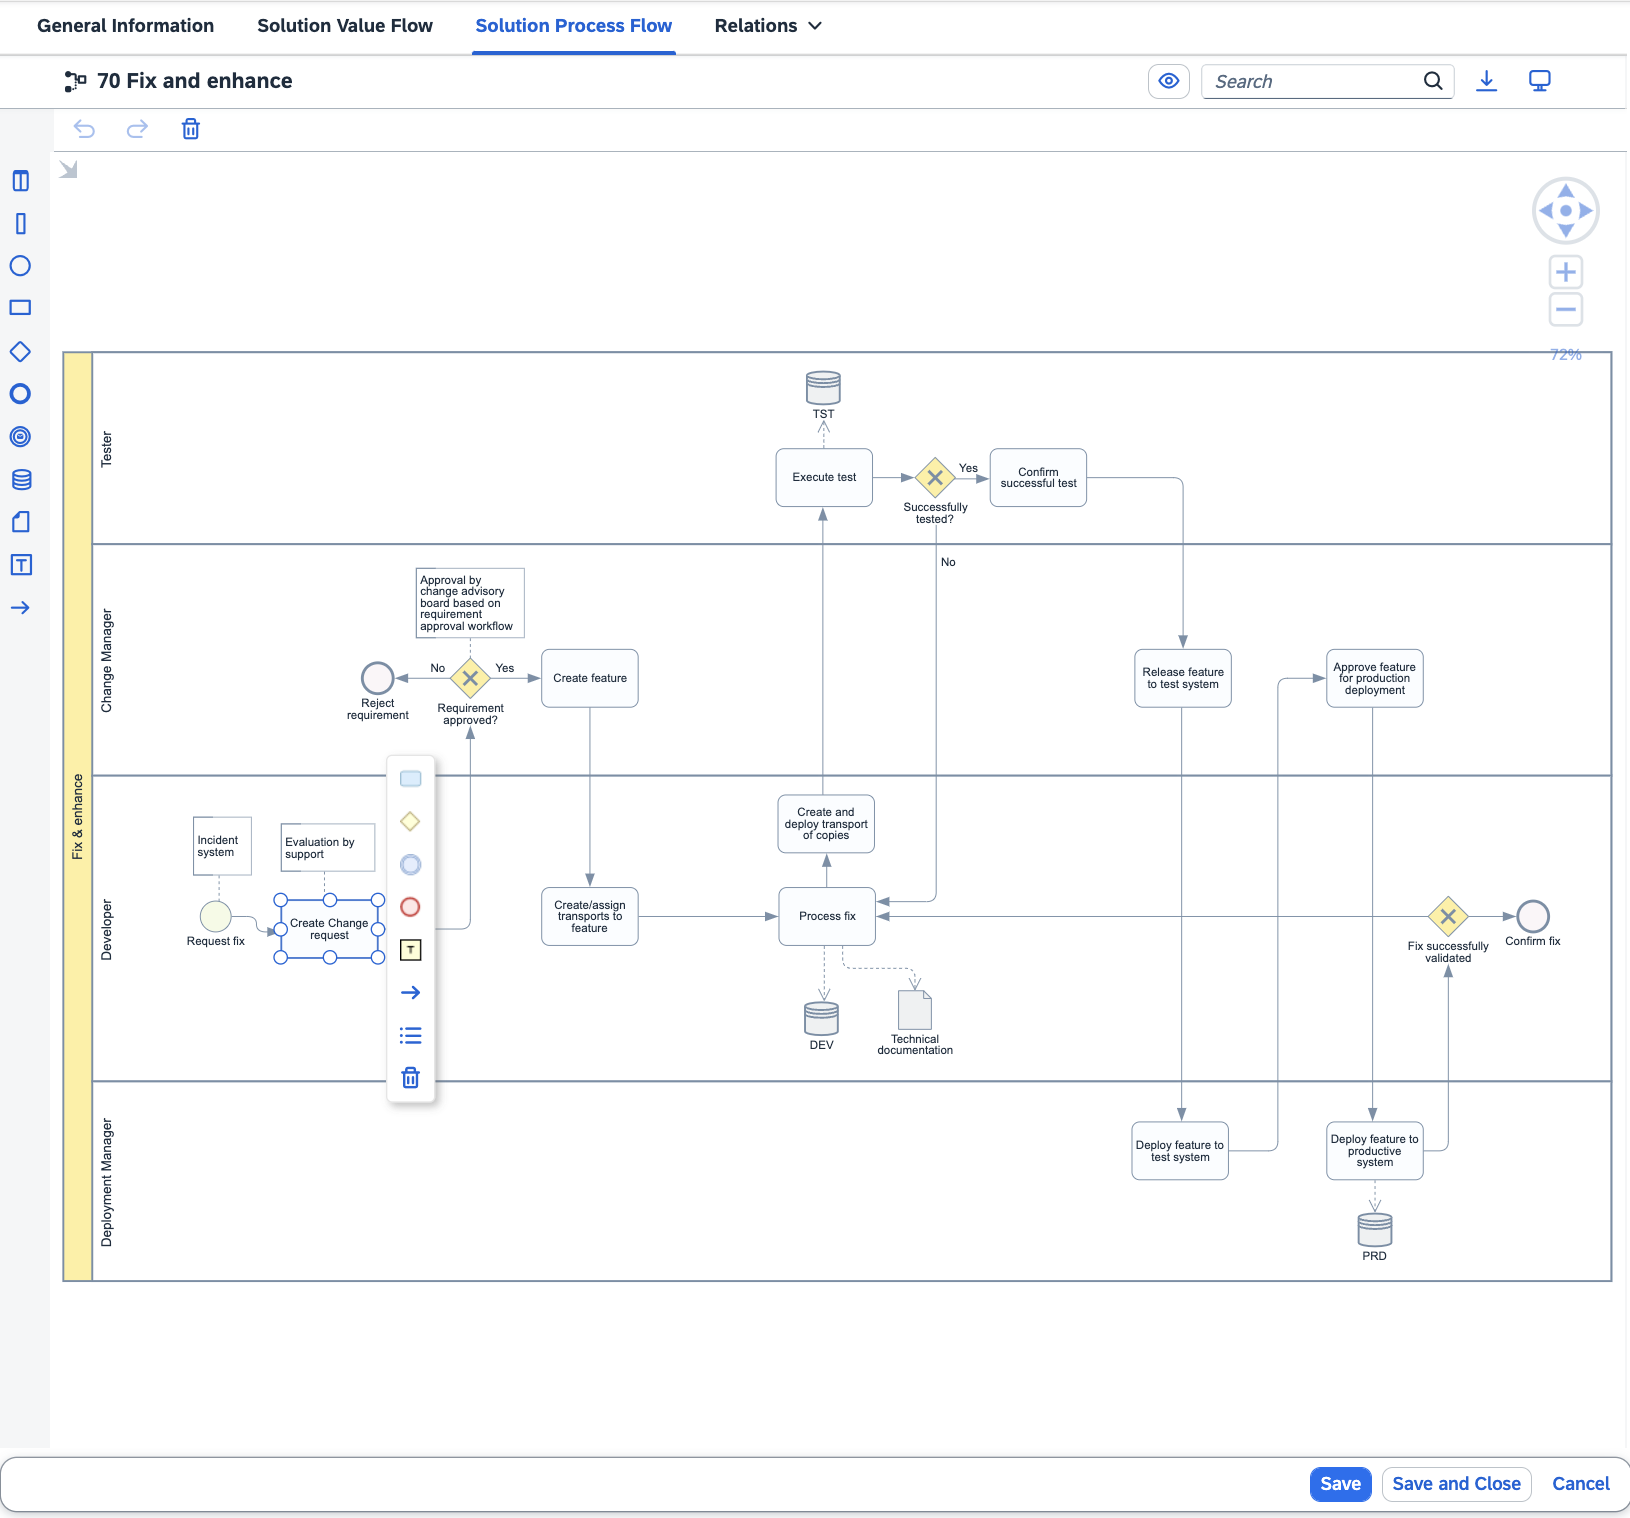
How can we now activate and customize them? I will give an example of the Fix & Enhance process. This process shows how solutions can be improved and enhanced iteratively – usually in the so-called maintenance phase, which comes after the project phase. In this Fix & Enhance process, you may want to integrate the integration of incidents and changes as a starting point from another tool in SAP Cloud ALM with a feature and not with a requirement, as envisaged in the best practice flow.
Important: I am deliberately not talking about an operations/operations “phase” here, but about a maintenance/maintenance “phase”, because the functions for operations/operations are reserved for the monitoring area in SAP Cloud ALM.
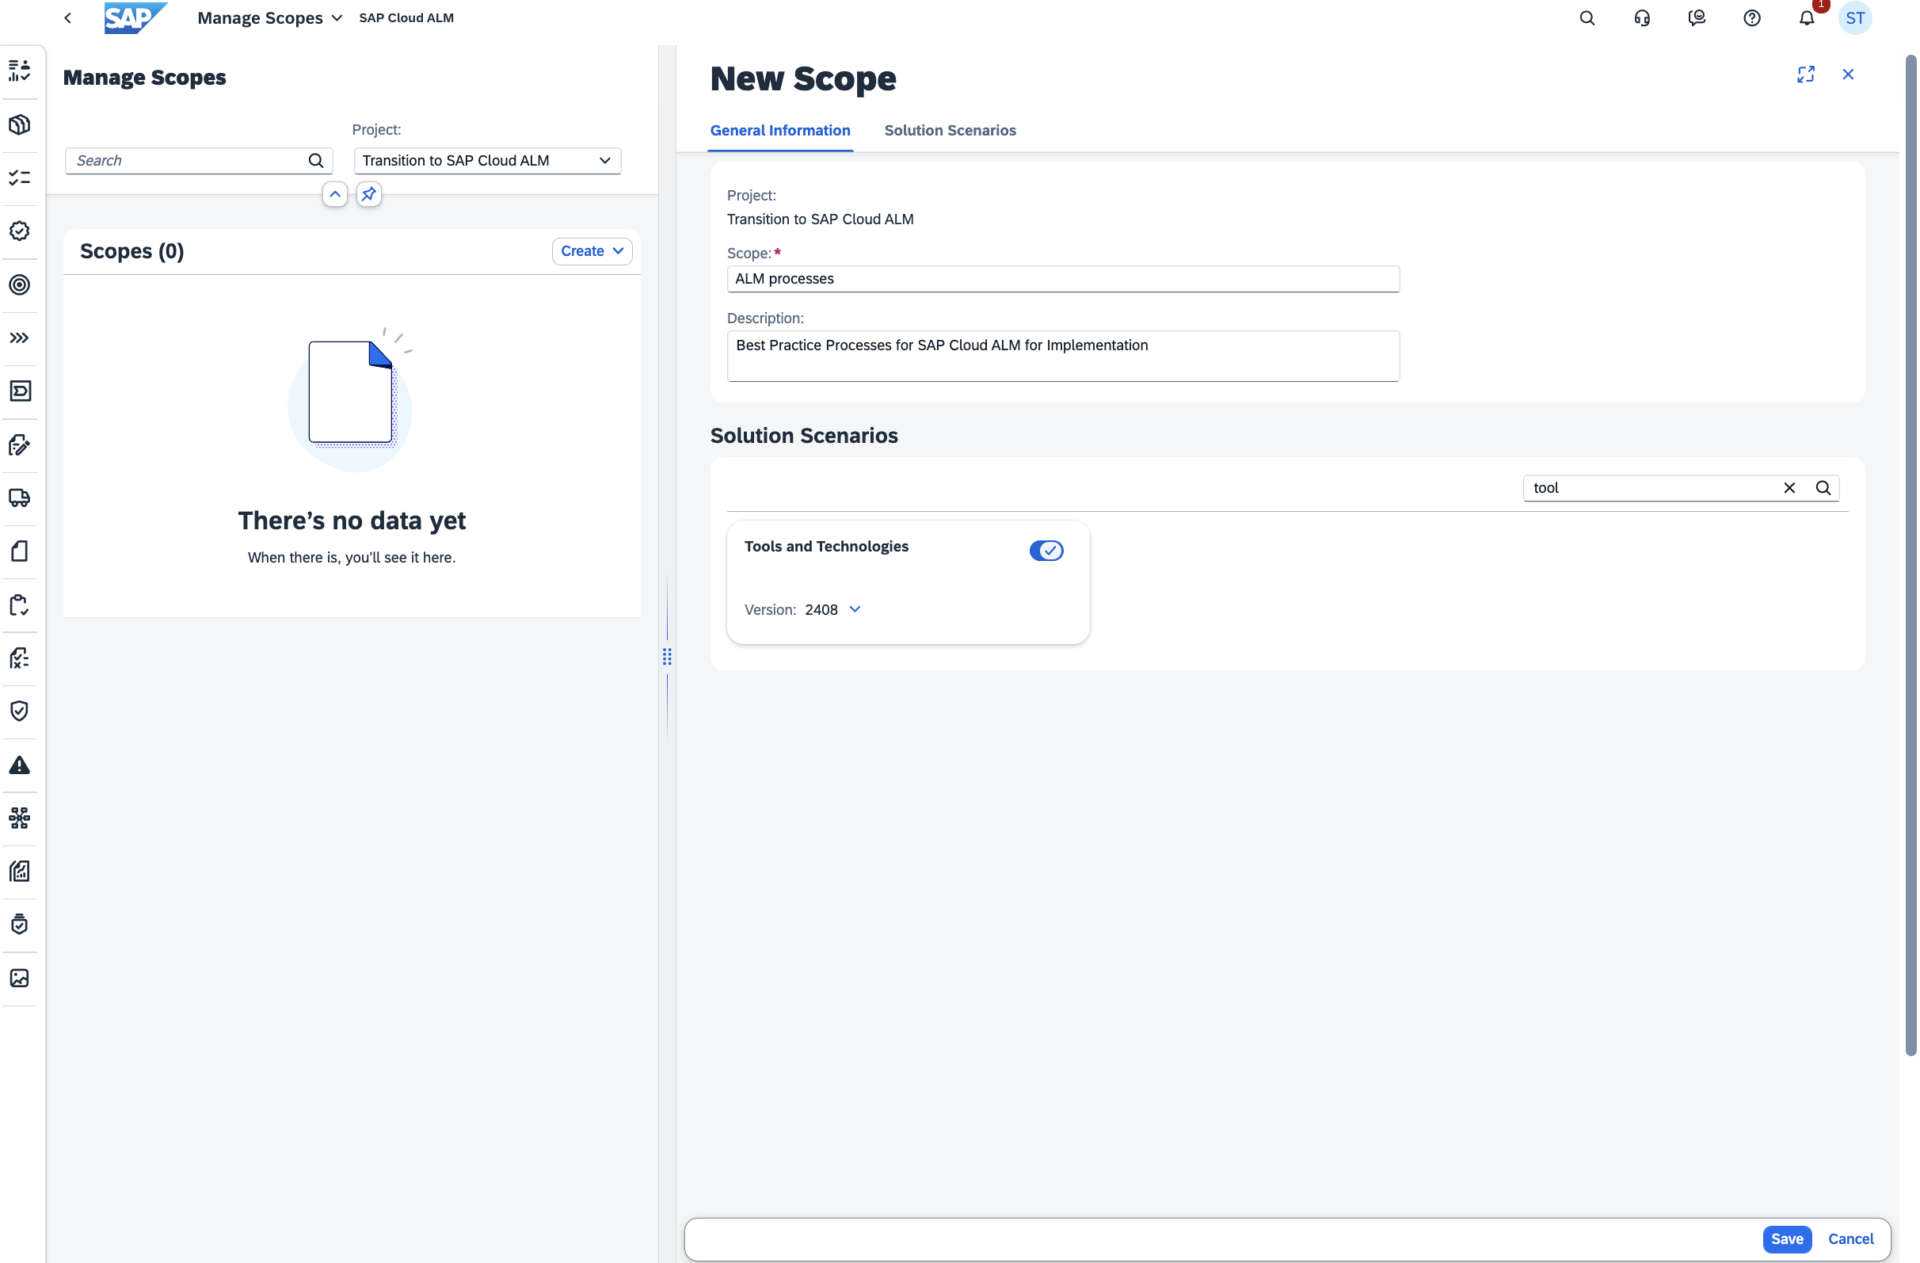
Step 1: Create a new scope for the “Tools and technology” solution scenario within a project
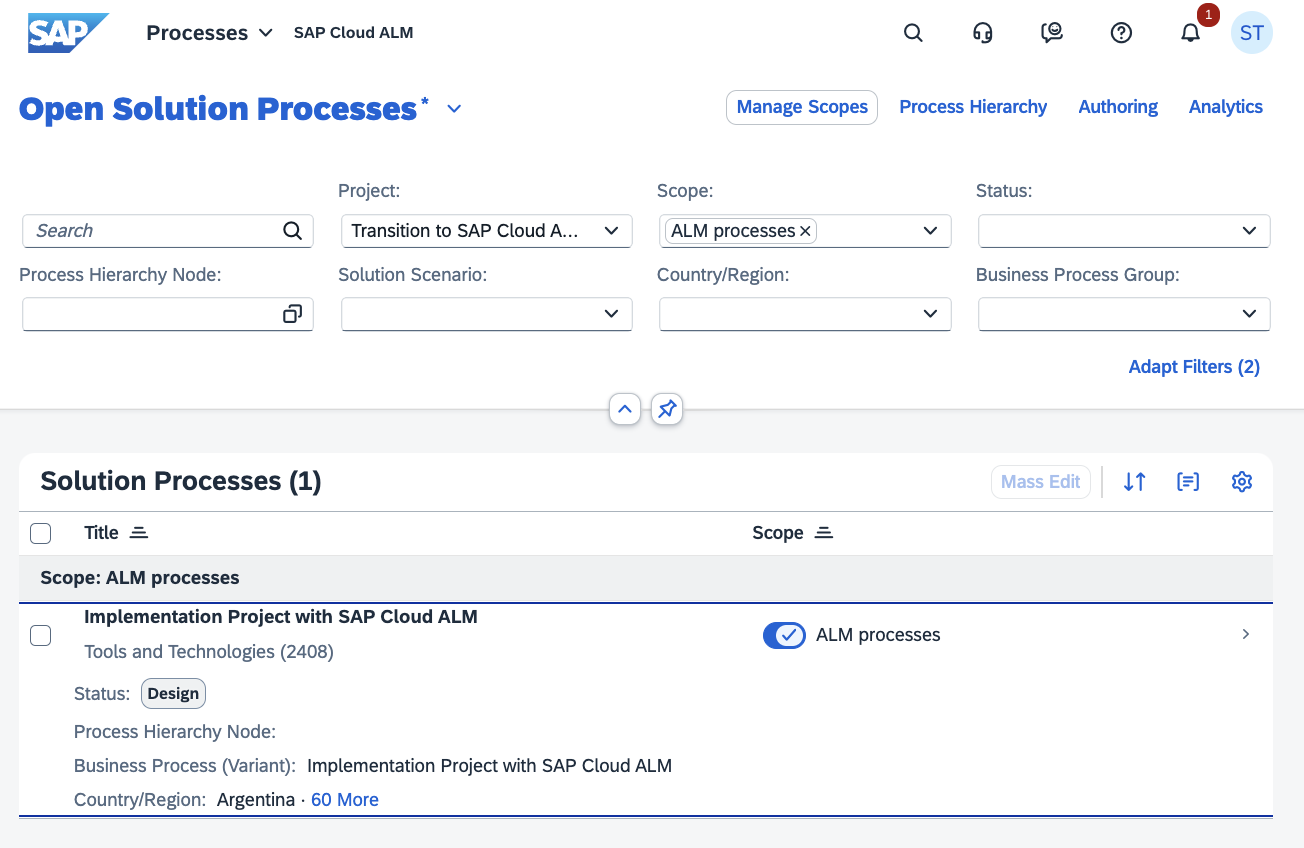
Step 2: Include solution processes of the solution scenario in the scope (via toggle switch)
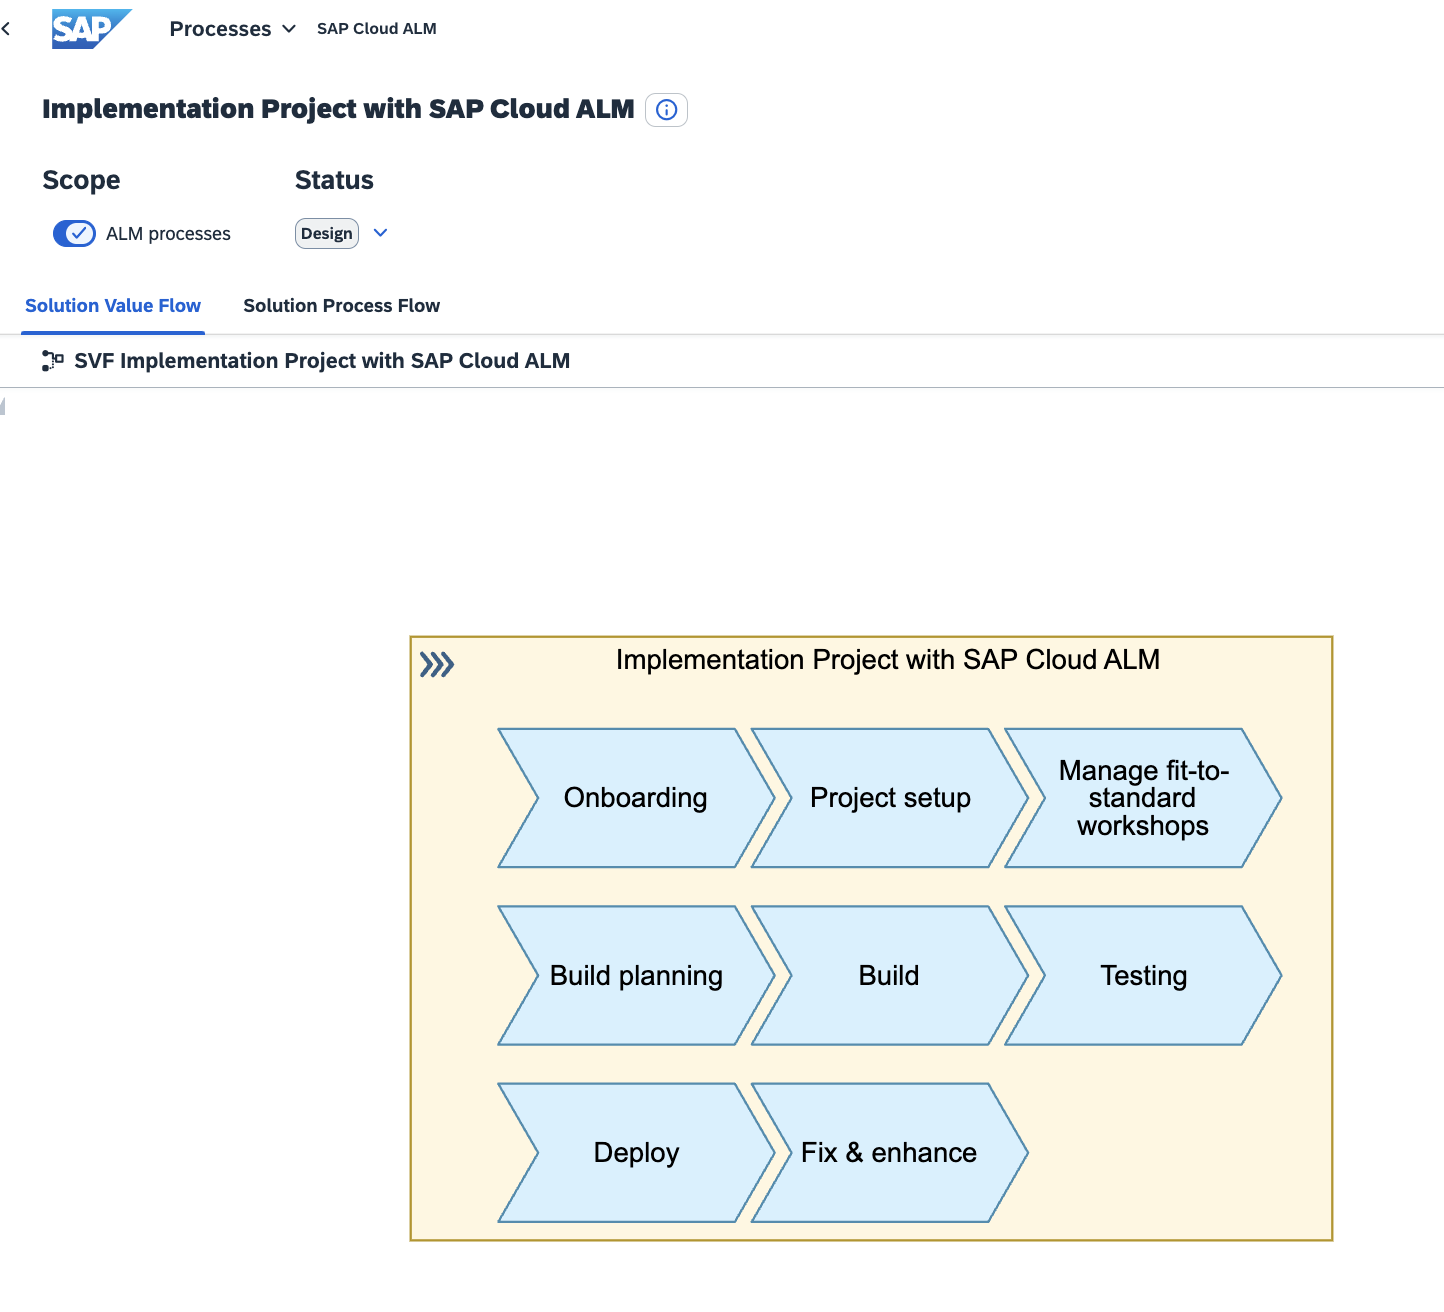
The result can then be viewed immediately, as the solution value flow and the solution process diagrams are visible
Step 3: Create a copy of the solution process
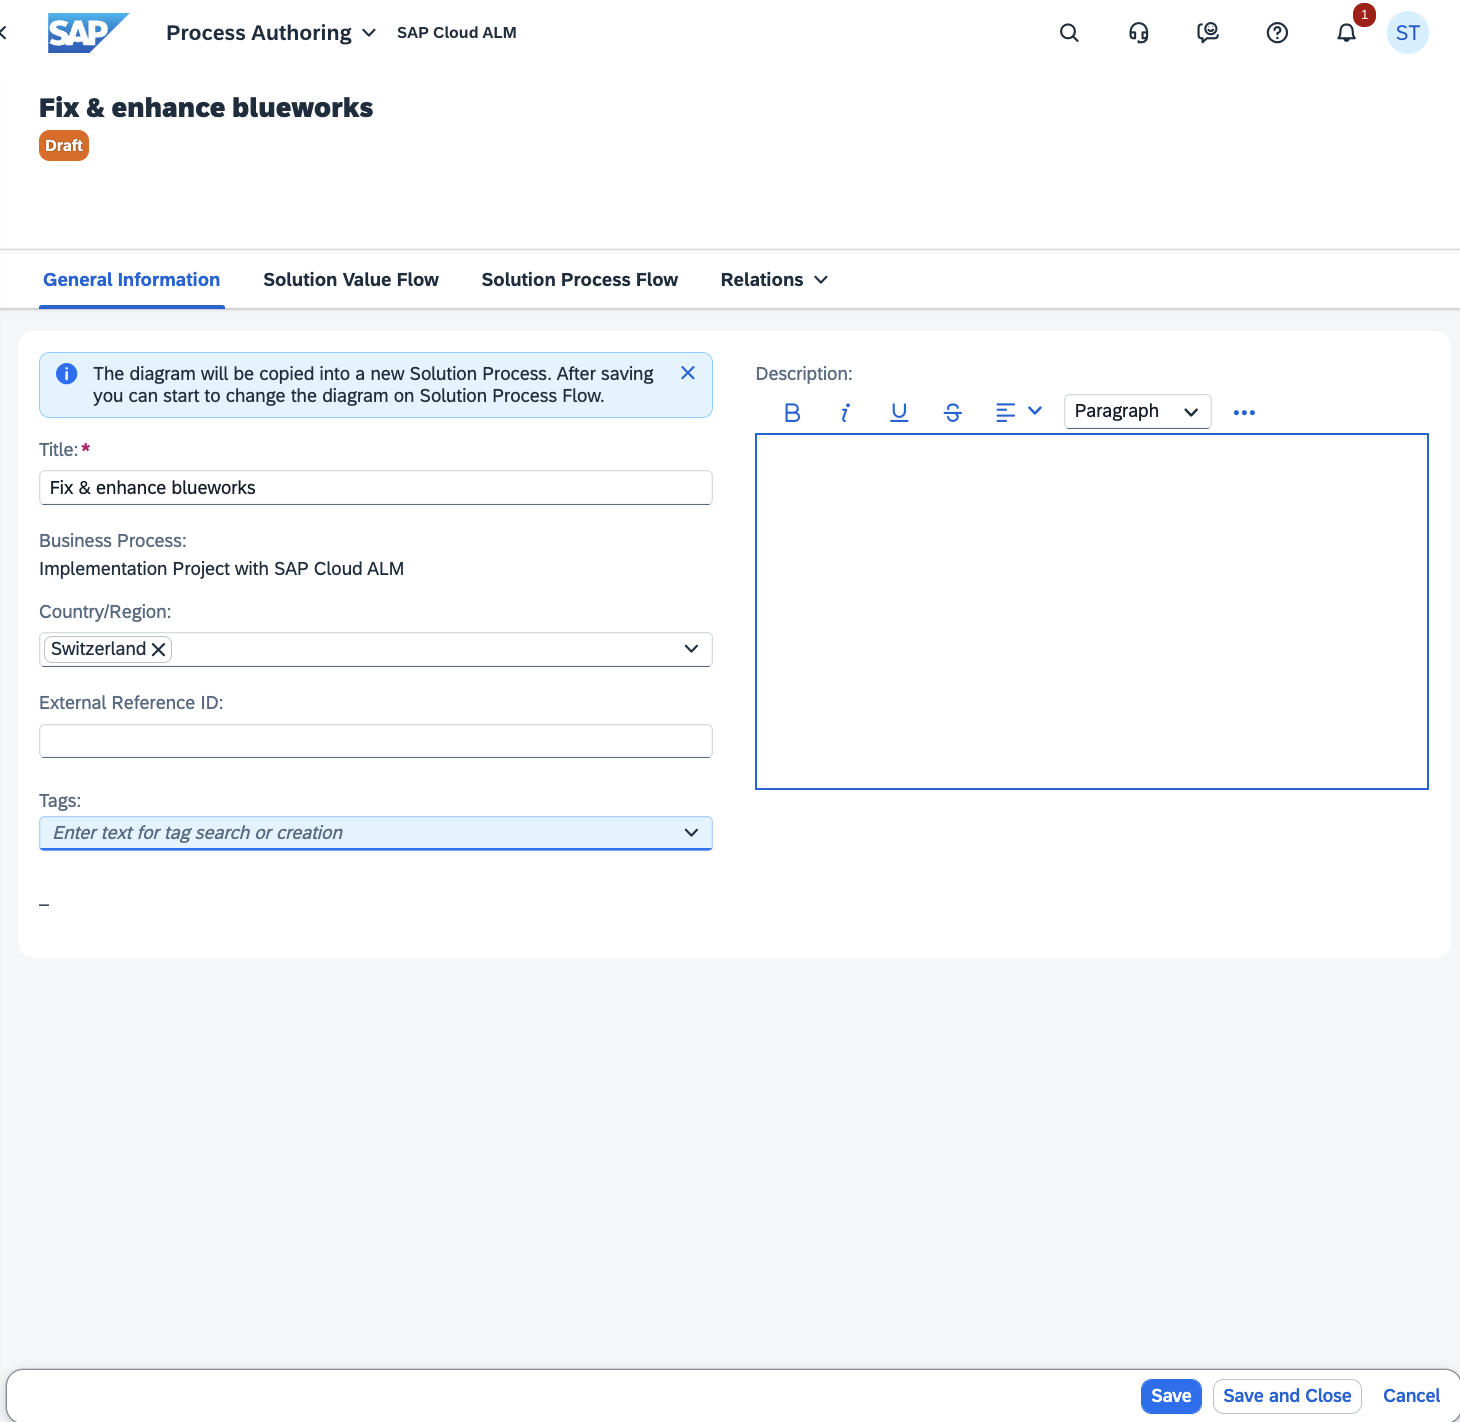
Step 5: The copied diagrams can now be adapted to the company’s requirements, saved and published
💎Why all this?
Thanks to the visualized roles and activities, everyone involved understands the process. We create transparency and are efficient because we don’t need another tool and can build on the best practices.
Ultimately, this is extremely helpful for following even complex processes and ensuring that nothing is forgotten.
➡️ And one last tip
Uses the initial experience with BPMN for the ALM processes to document the business processes in the same form. This creates uniform standards that generate transparency and promote collaboration between IT and specialist departments.
The integrated tools and best practices in SAP Cloud ALM make ALM process management not only efficient, but also intuitive.
Many of us enjoy a freshly baked donut. We not only think of the delicious taste, but also of the shape – a ring. And although you might reflexively think that the article at hand is dealing with the analogy of the outer shape of a donut and the Application Lifecycle Management ring, I will not go into that, but rather into the difference between plan-driven and value-driven development and their problems.
The question of why certain features are still missing from SAP Cloud ALM is particularly interesting. Many customers ask precisely this question: why is this or that feature still not available? I am not trying to defend SAP here, because it could certainly be argued that with more or faster developer resources, some things could be implemented more quickly. But for me, it is more about creating an understanding of the challenges: How do you balance the pressure of customer expectations with long-term vision and quality assurance? This is precisely where the difficulty of combining both stability and flexibility in a plan-driven approach to deliver sustainable value becomes apparent.
From SAP SolMan to SAP Cloud ALM
SAP Solution Manager (also affectionately known as SolMan by the community) will no longer be covered by mainstream maintenance from the end of 2027. Although SAP Cloud ALM is not a direct successor to SAP Solution Manager, as there will be no feature parity, it is at least the logical successor.
And it is precisely here that the connection between a doughnut and SAP Cloud ALM arises. We have already established that almost everyone knows that a doughnut is ring-shaped. Many of you also know what a good doughnut should taste like. And SAP customers know what the SAP Solution Manager looks like and what ALM functions it offers. It is therefore obvious that these are the functions that are expected of the “successor product”.
The Solution Manager can therefore be compared to a well-known doughnut recipe. It is a recipe and a preparation in which we know exactly which ingredients belong and what the end result should be. It is a proven recipe that is loved by many.
The development of SAP Cloud ALM, on the other hand, represents a completely new recipe and approach. It is no longer developed in a plan-driven manner, where the end product and its features are fixed from the outset. Rather, it is a value-driven approach that prioritizes customer value and benefit.
Value-Driven vs. Plan-Driven Development: A Recipe Duel
Understanding the differences between value-driven and plan-driven development is important to recognize the benefits and challenges. Here is a comparison:
Plan-Driven Development (PDD)
PDD is based on a systematic and sequential approach in which each phase (requirements, design, implementation, validation) of software development is strictly planned before it actually begins. The scope of services is fixed, while the costs and deadlines are “variable” or the levers that can be adjusted.
Planning: The main focus is on advance planning. It is expected that all requirements will be determined at the beginning of the project and that little or no change will occur during the course of the project.
Documentation: PDD emphasizes the importance of comprehensive documentation. Each step is documented in detail to ensure that all parties involved understand the process and requirements exactly.
Flexibility: PDD is usually less flexible with regard to changes, since changes are often costly and time-consuming, especially if they are made late in the process.
Risk management: PDD tries to minimize risks early on by planning everything in advance.
Examples of methods: Waterfall model, V-model.
Value-Driven Development (VDD)
VDD focuses on creating continuous value for the customer or end user by relying on feedback and iterative development. With this approach, the costs and deadlines are “fixed” and the scope of services is variable. Good, agile requirements engineering is a must for VDD.
Planning: Instead of strictly adhering to a predetermined plan, VDD flexibly adapts to new information or changing customer needs.
Documentation: While documentation is still important, it can be less extensive in VDD than in PDD. The focus is on functional software and customer feedback.
Flexibility: VDD is very flexible with regard to changes, since the approach expects that requirements may change over time.
Risk management: VDD accepts that risks exist, but relies on minimizing them through regular feedback loops and adjustments.
Examples of methods: Agile development methods such as Scrum and Kanban
Plan-driven Development: As familiar as a glazed doughnut or an SAP Solution Manager
A few years ago, SAP Solution Manager was developed. A platform for implementing and operating SAP solutions (mainly for on-premise products). The recipe is fixed, the ingredients are known, and the result is predictable, i.e. the principle for the development of SolMan was largely the systematic approach of “plan-driven development». Similar to an architect who plans every detail before construction begins.
The challenge of change: SAP Cloud ALM
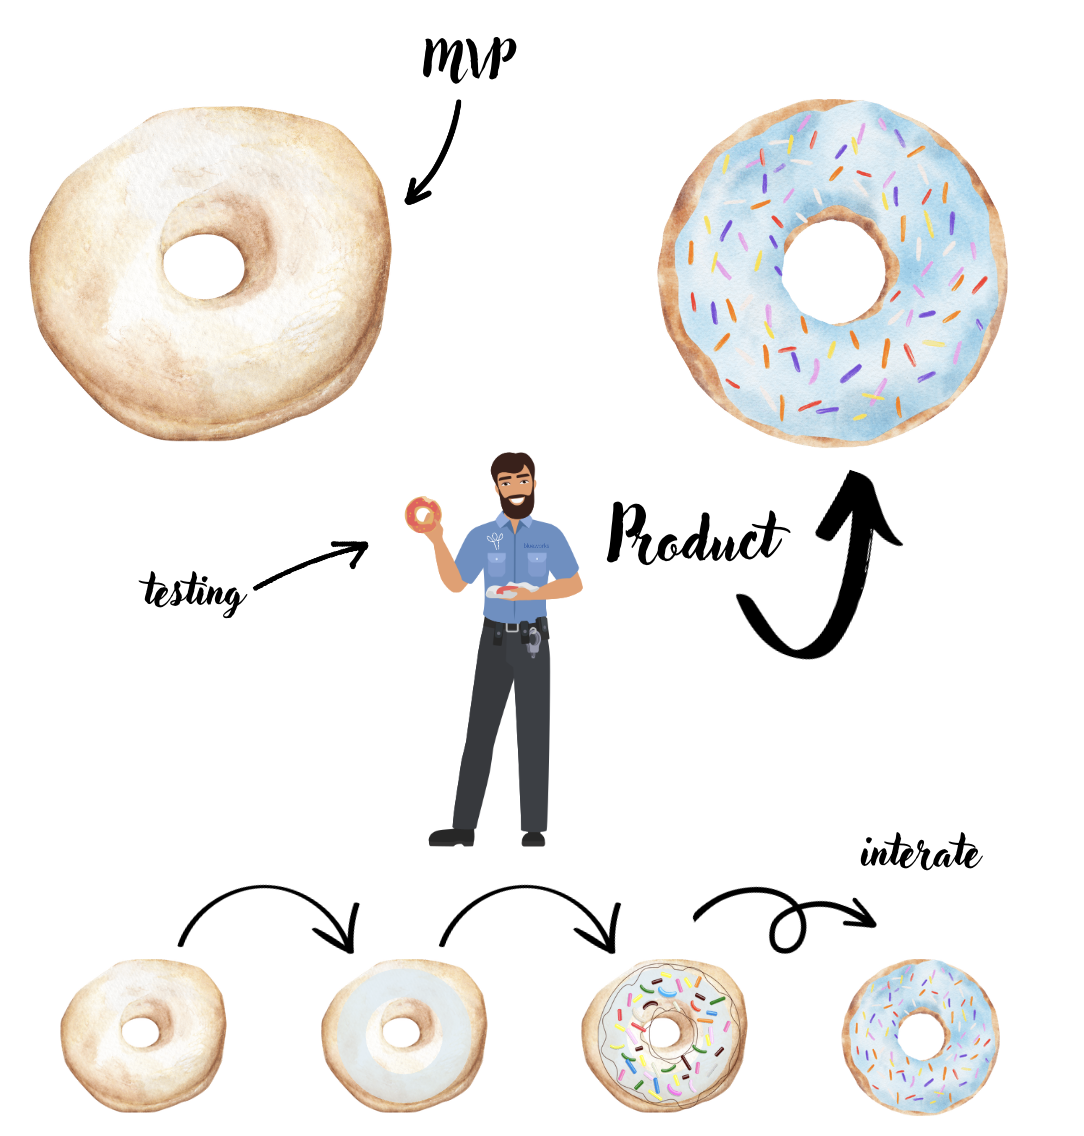
Imagine you are standing in a modern doughnut bakery. Instead of just baking a set doughnut, the baker experiments with different ingredients. He first brings you the naked dough ring, the basic structure – a minimum viable product (MVP), so to speak. For some, this is already enough, others wait for the icing, still others for the sprinkles, and based on the feedback, the baker can gradually (in several iterations) refine the doughnut. Still others give feedback and demand a certain filling. Which way is the right one?
The development of SAP Cloud ALM is reminiscent of the trend towards experimental doughnut flavors. SAP Cloud ALM was also developed for the implementation and operation of SAP solutions, but with a clearer focus: for SAP cloud products.
Agile development at SAP Cloud ALM is now like the baker stopping by every two weeks and saying, “Try this!” But instead of a full doughnut, there might only be one bite. Some customers are excited about the quick delivery and the opportunity to provide feedback. Others might be disappointed that the doughnut isn’t “done” yet.
A world of flavors that is constantly changing
Just as the world of donuts is constantly evolving – just think of trends like cronuts or donut burgers – so is our world of information systems and general conditions. The most important thing is that we are prepared to adapt, provide feedback and be open to the countless possibilities that lie ahead.
Value-driven development requires flexibility and openness to change. And while some customers appreciate the opportunity to design their own “donuts,” others find it challenging to constantly adapt to new flavors.
A shift in mindset is needed in at least three ways:
1. Development teams must adapt so that they are able to actually develop a product in an agile way.
2. Customers must develop the willingness and acceptance that not every function already adds 100% value, but that sub-functions can be used more quickly and at least add partial value.
3. Customers must embark on a journey and not just demand functions because they “have always done it that way”, but question whether alternative approaches could bring even greater benefits.
In a constantly changing (digital) world, we should perhaps all adopt the values of doughnut lovers a little more: curiosity, flexibility, patience and an open mind for the next potentially best and sweetest bite of doughnut innovation – even if one or two attempts don’t taste so good 🍩
Welcome to the latest edition of our bi-weekly SAP Cloud ALM update series! Every two weeks, we bring you the newest innovations, performance improvements, and interface enhancements designed to elevate your Cloud ALM experience. In this edition, we’ll dive into the exciting updates introduced in week 48. Stay tuned for a closer look at what’s new!
Services
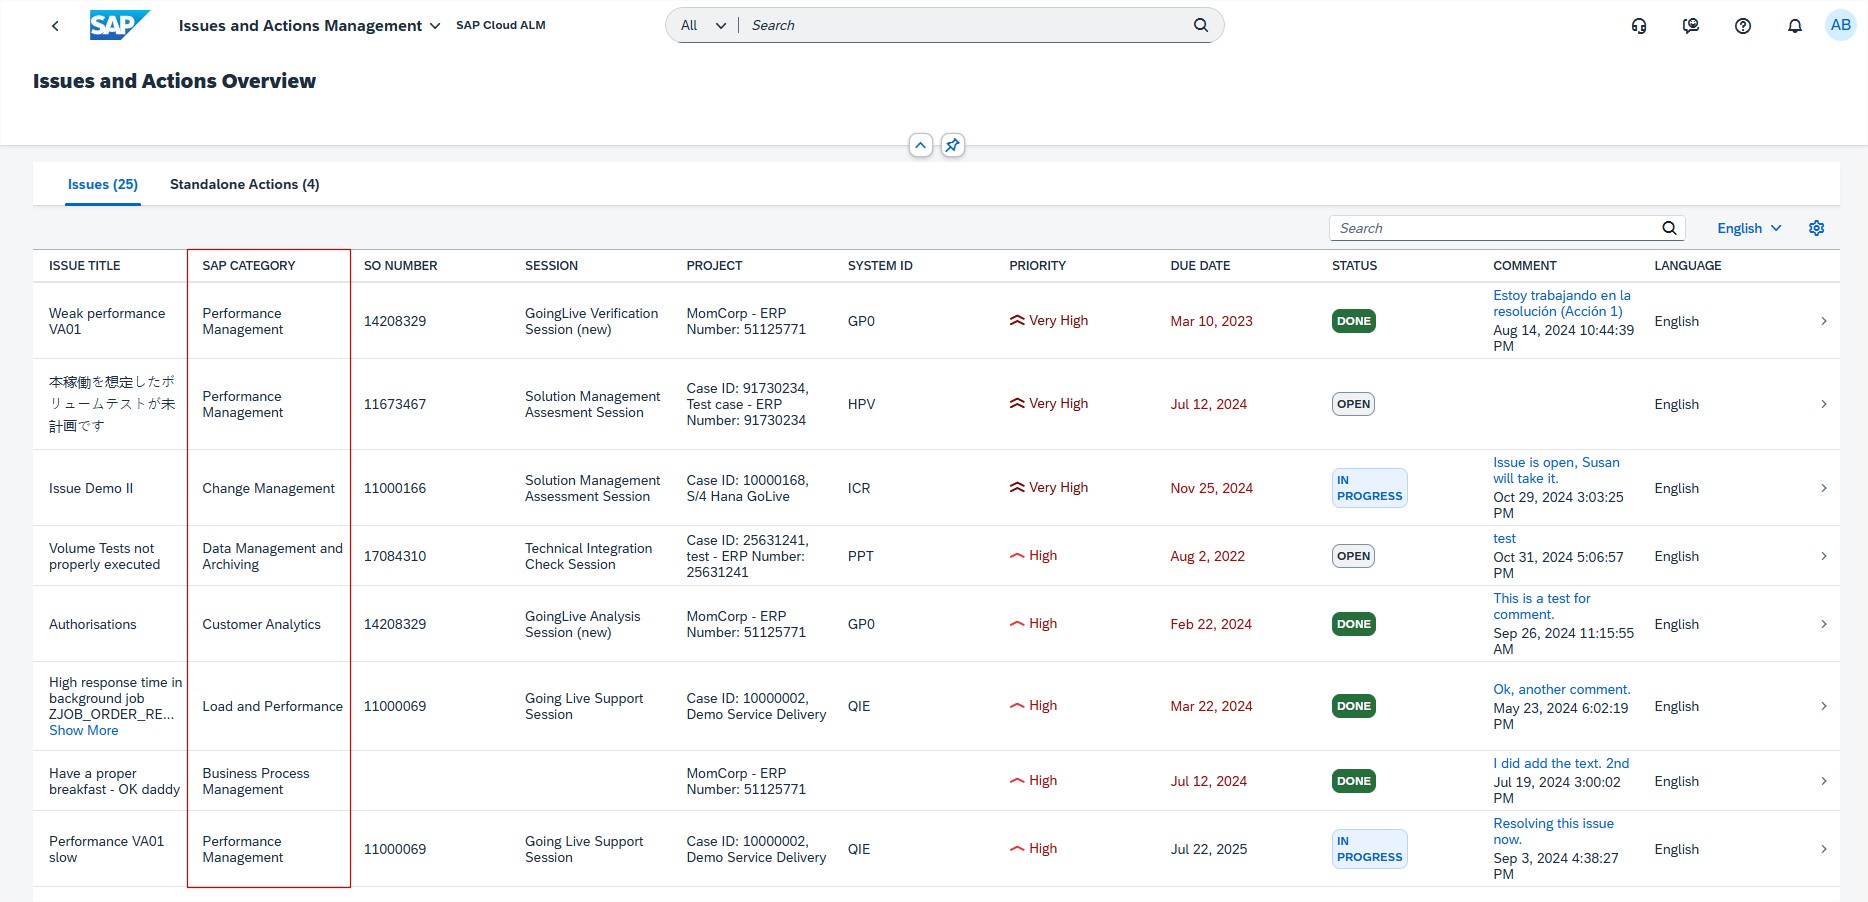
In Issues and Actions Management, issues and standalone actions are now categorized based SAP Category instead of the Issue Type. Now it’s possible to filter the issues and standalone actions by SAP Category.
Implementation
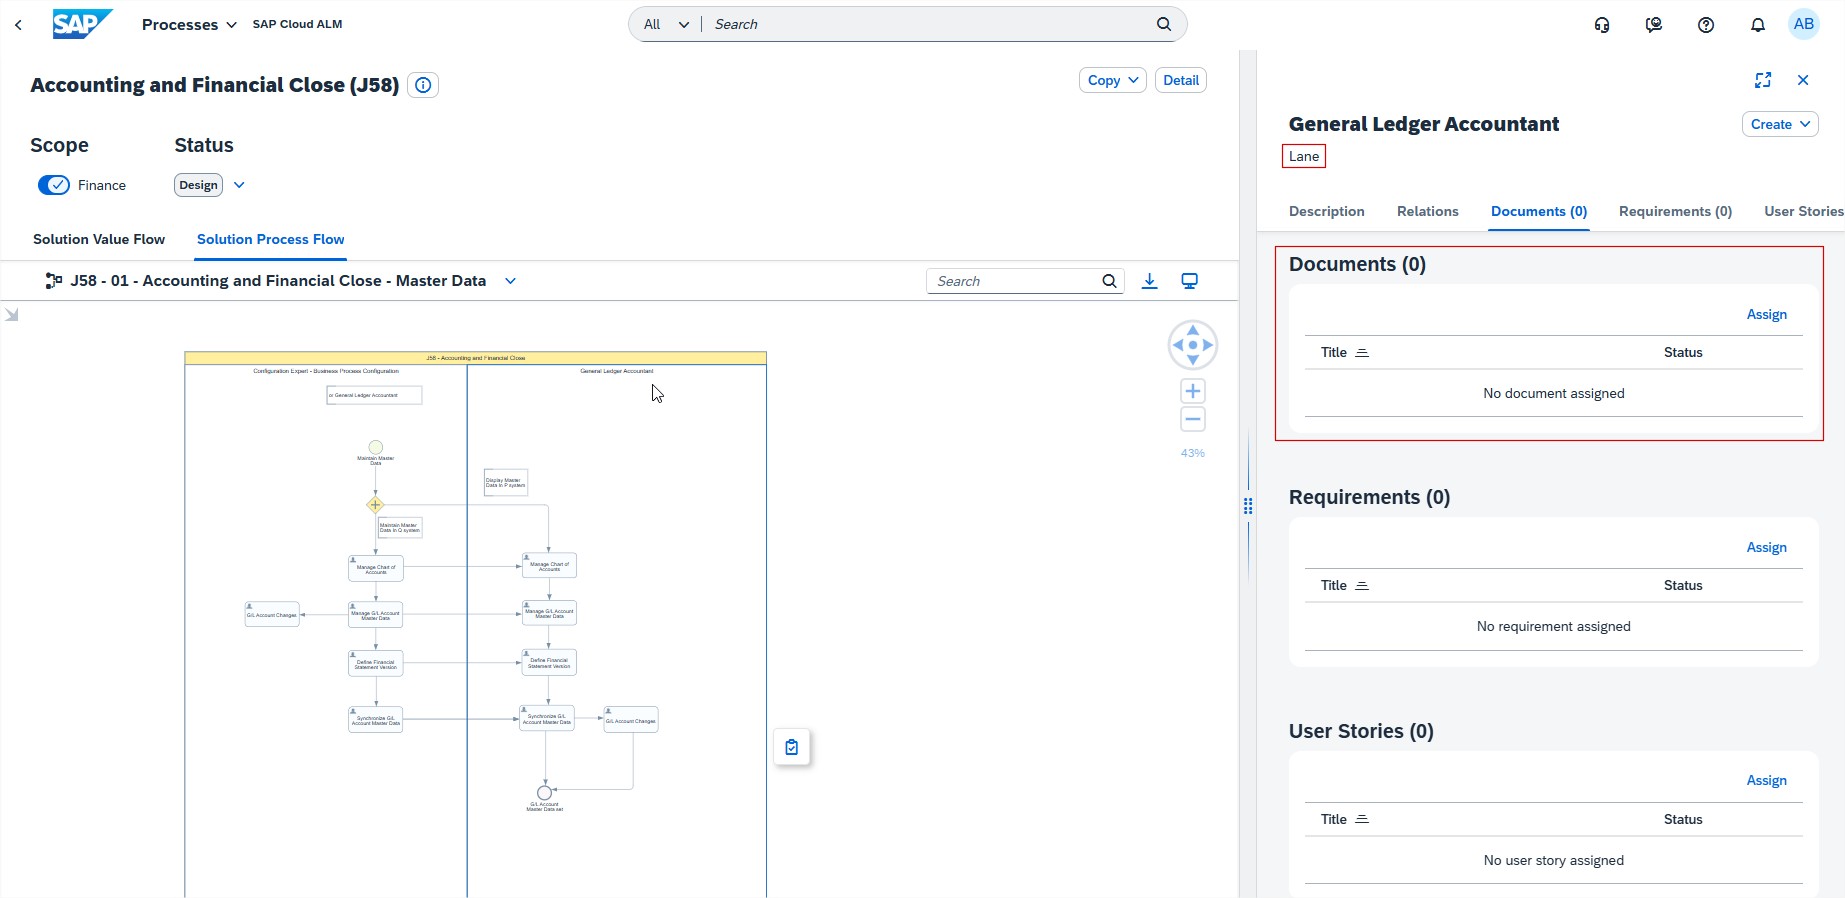
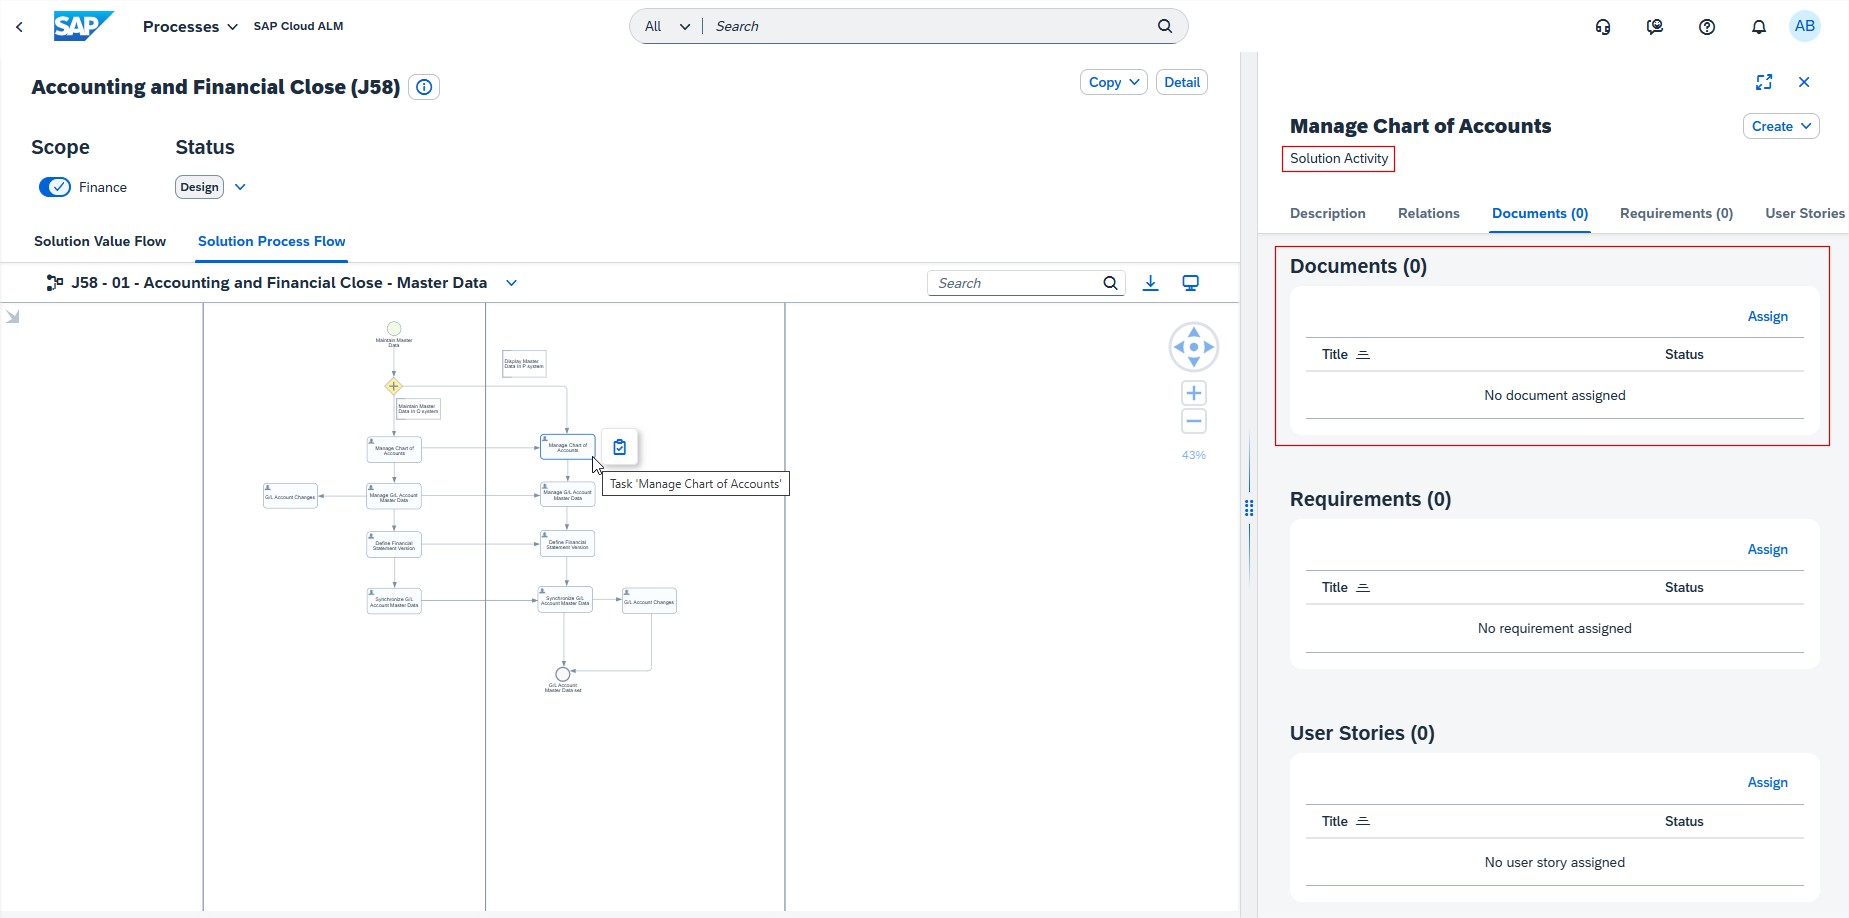
Processes allows now to assign the same document multiple times to different entities of a solution process in the context of a project and scope. For example, it’s possible to assign the same document to a lane and to a solution activity within the same solution process flow.
Keep in mind that a document can still only be assigned once to a given entity (for example: the same document can’t be assigned twice to the same Solution Activity in the context of a Project, Scope, Solution Scenario, Solution Process, Solution Process Flow, or Solution Process Flow Diagram).
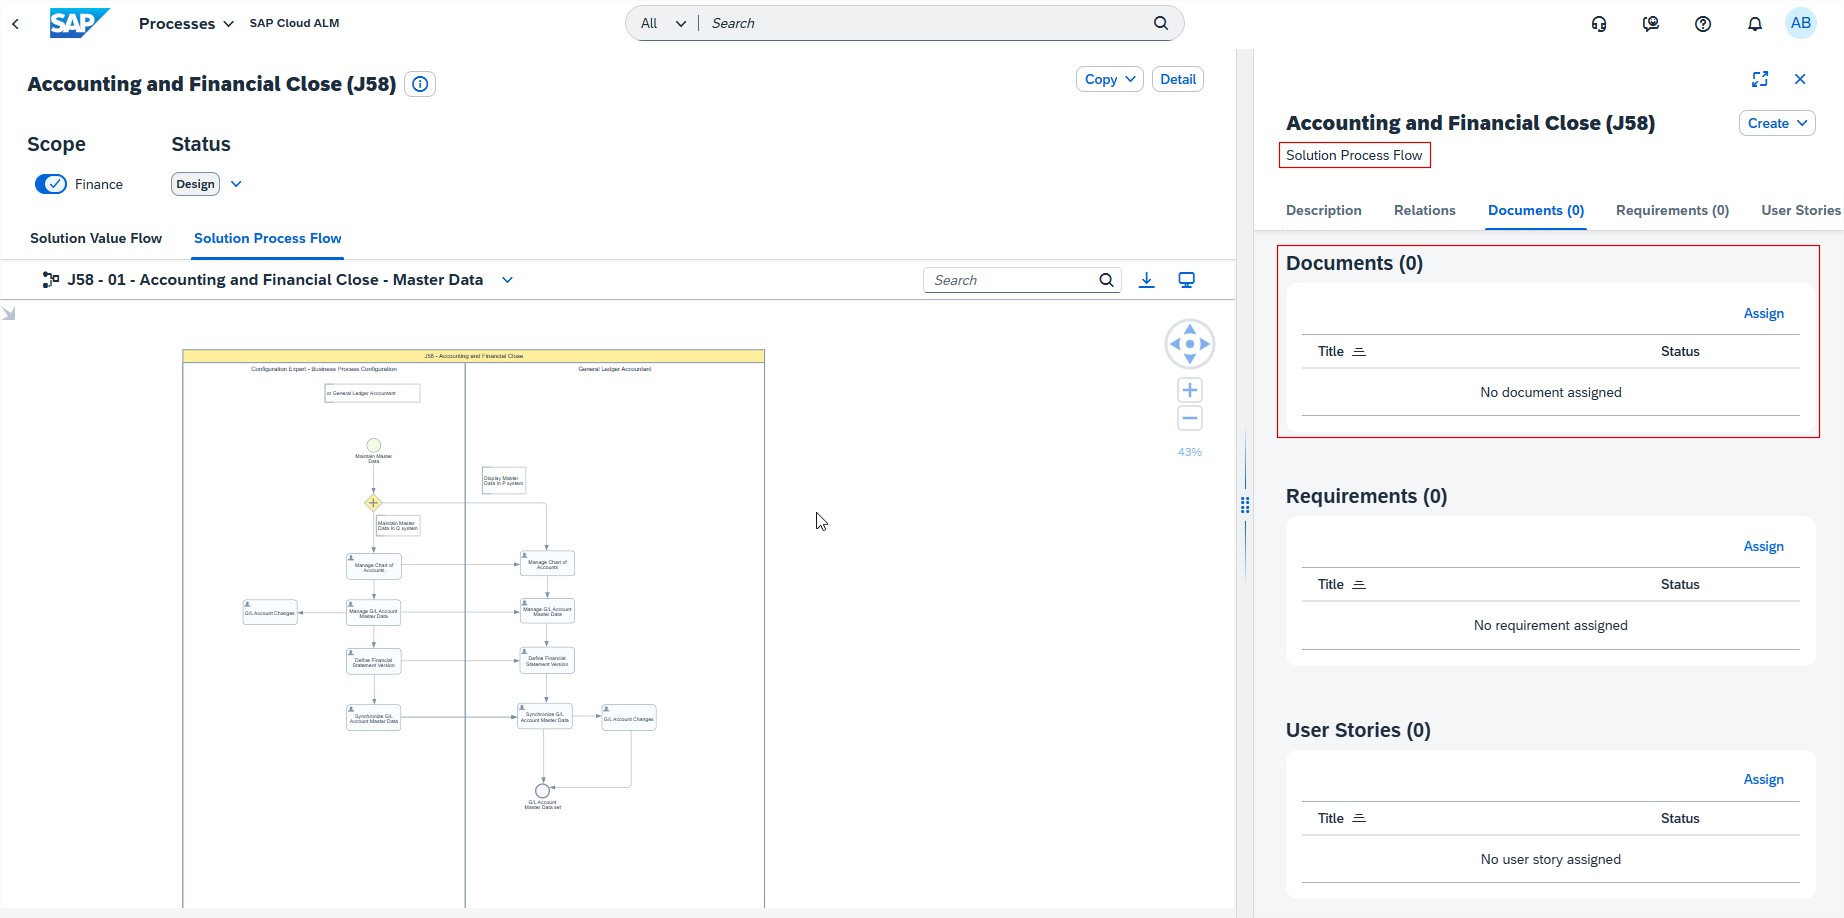
When selecting the whole diagram (by clicking outside its borders), only documents directly assigned to the diagram (not to one of the entities within it) are displayed. The same applies for Requirements, User Stories or Tasks. For an overview of such assignments, please refer to the Solution Process Traceability app.
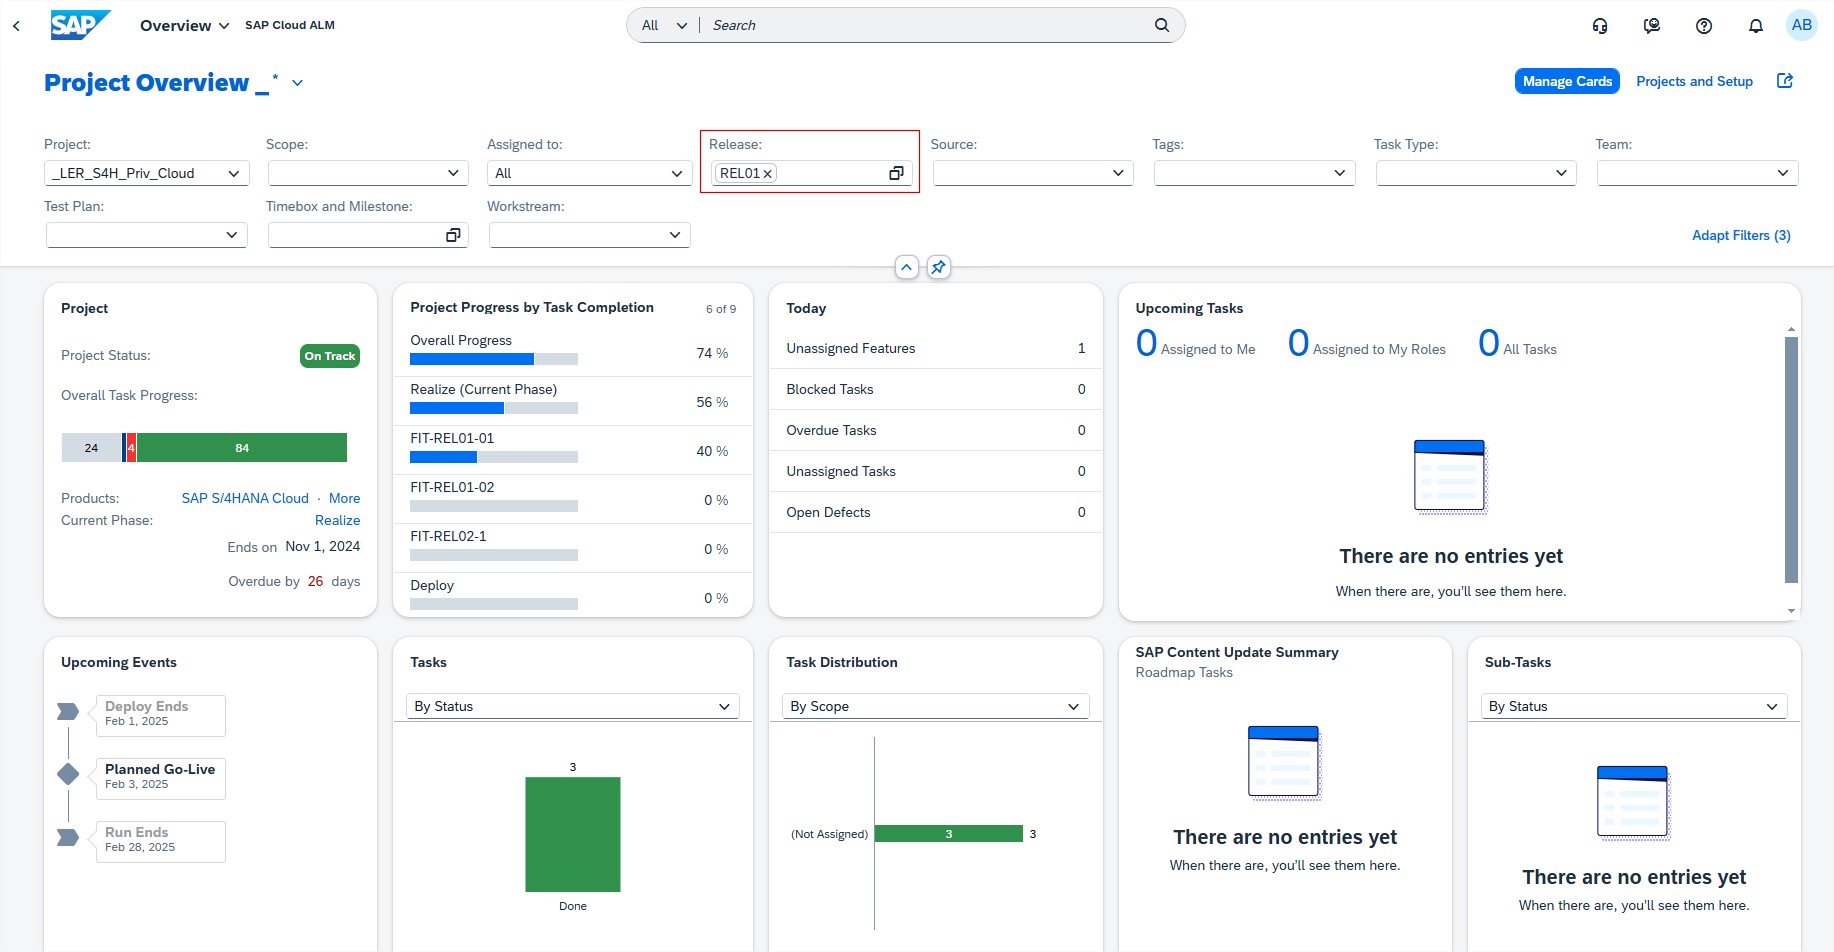
Overview app has now the option to filter by Release. By using the filter, the data for the Tasks, Requirements, Features, and Defect Distribution cards is updated.
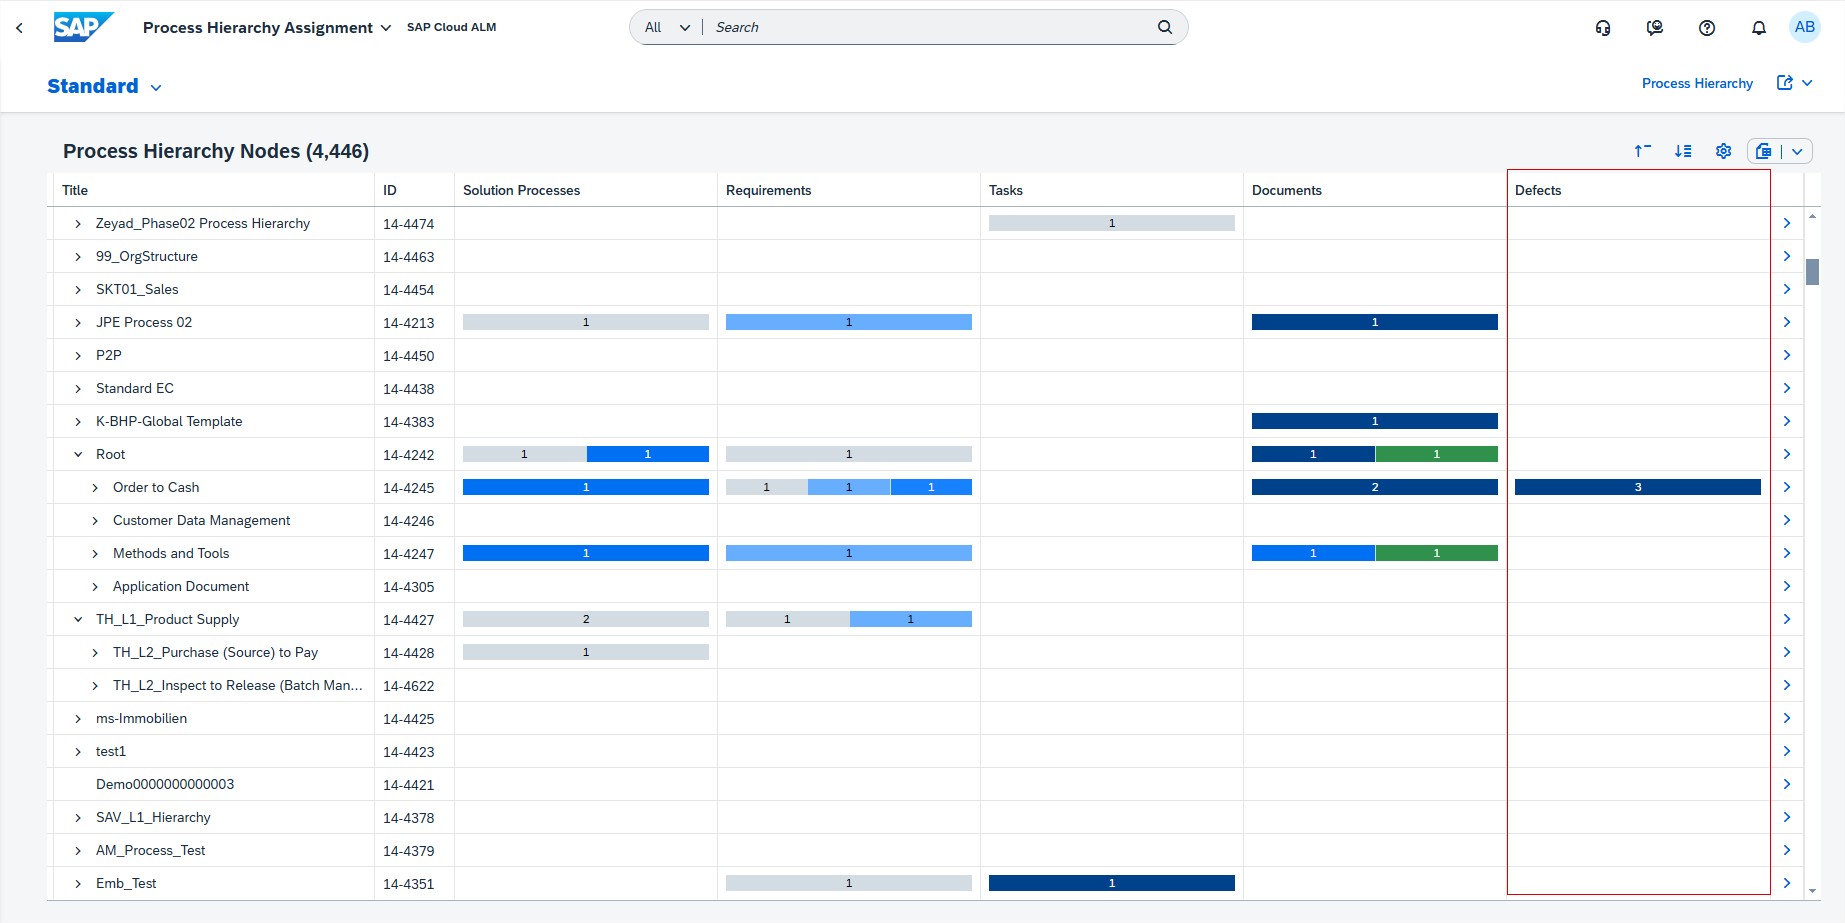
In Cross-Project Overview, the Process Hierarchy Assignment app now features a new Defects column.
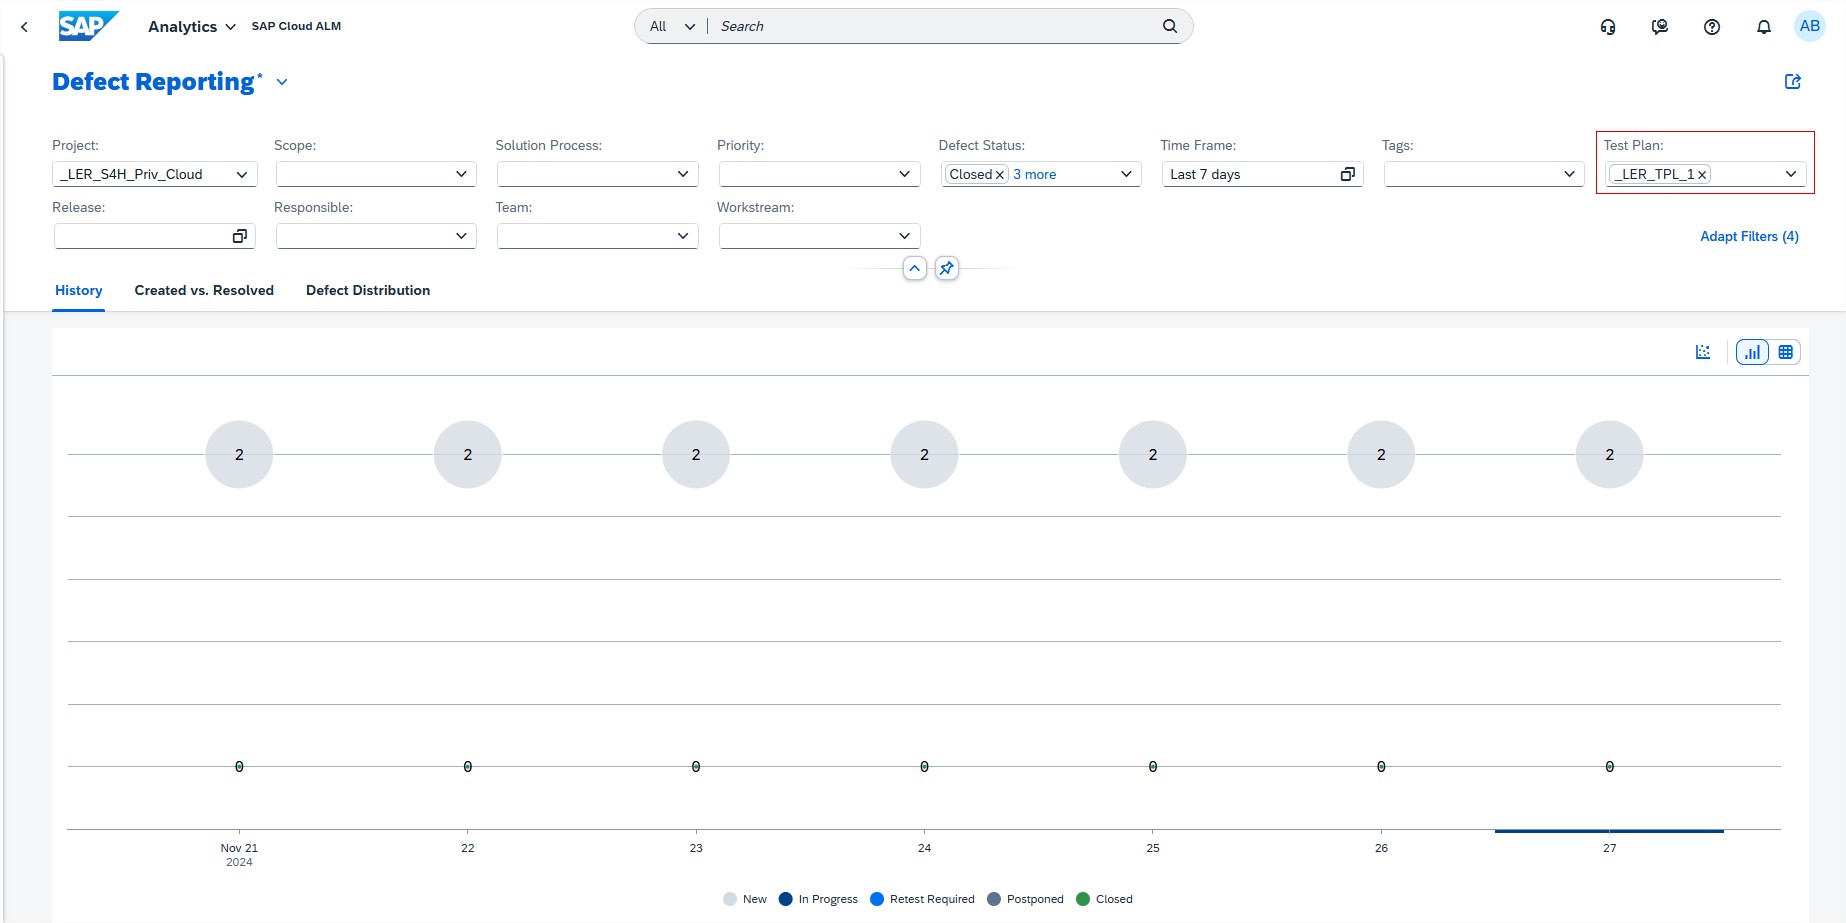
Analytics introduced a new filter Test Plan in the Defect Reporting app. Now all tabs are filtered accordingly, with the Defect Distribution tab also offering a By Test Plan selection for defects.
Operations
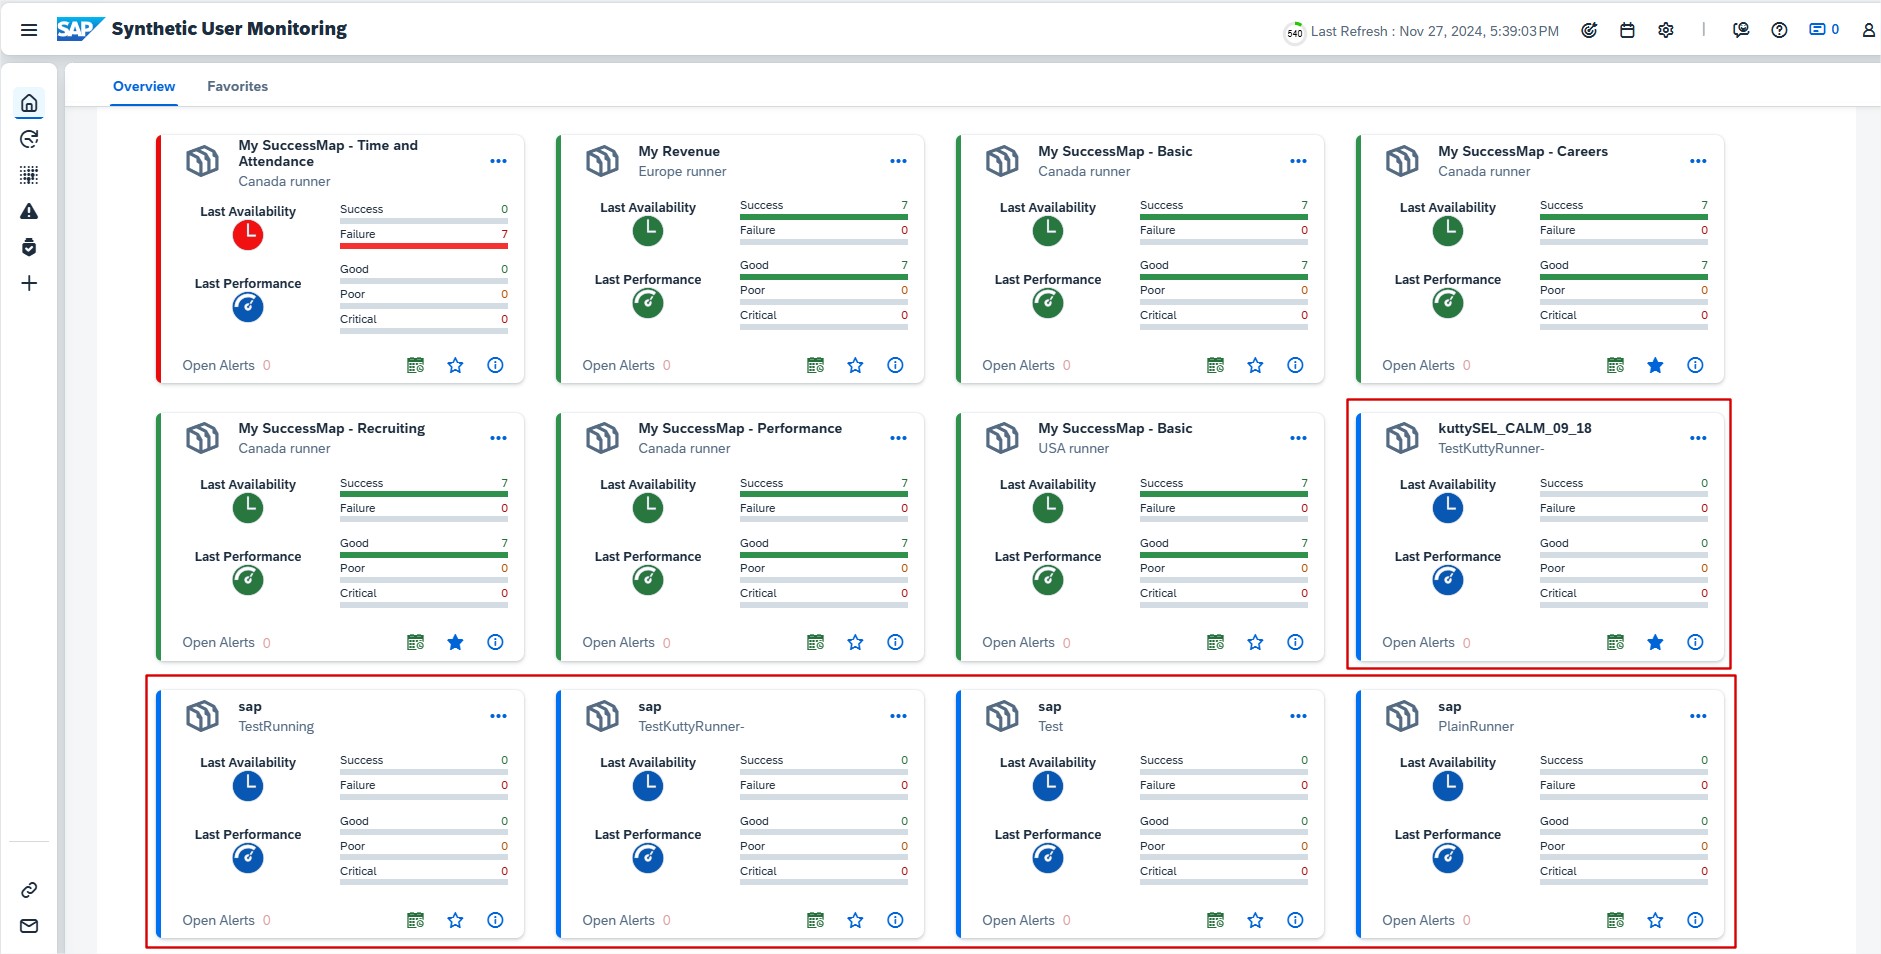
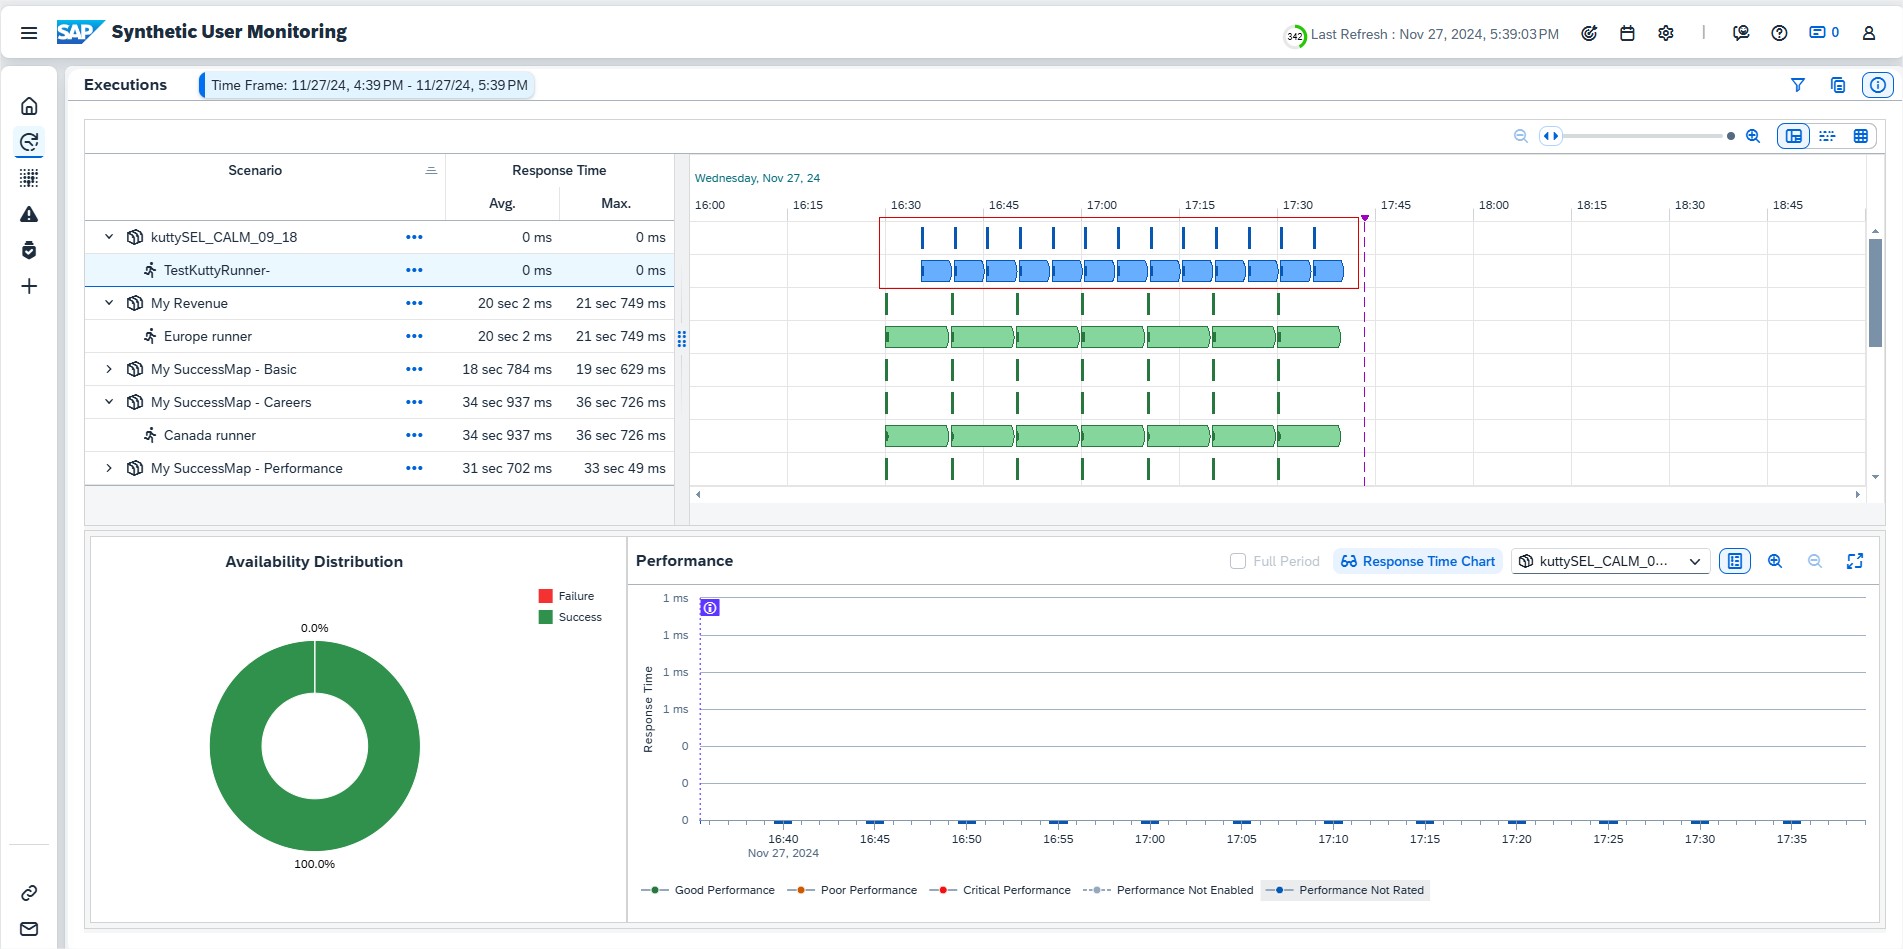
Synthetic User Monitoring has now improved Availability Status.
In case of executions failing due to monitoring issues (for example infrastructure issues, badly formed scripts, or internal errors), the availability for these executions is now not rated any more.
In the UI, they are not treated as follows:
In the Home page, they are not counted for the displayed statuses in the overview tiles. If the last execution failed due to a monitoring issue, the icon for the last availability is displayed in blue.
In the Executions, they are displayed in blue with the information Availability Not Rated.
No event is created when executions are failing due to monitoring issues.
Integration & Exception Monitoring has 2 new features available.
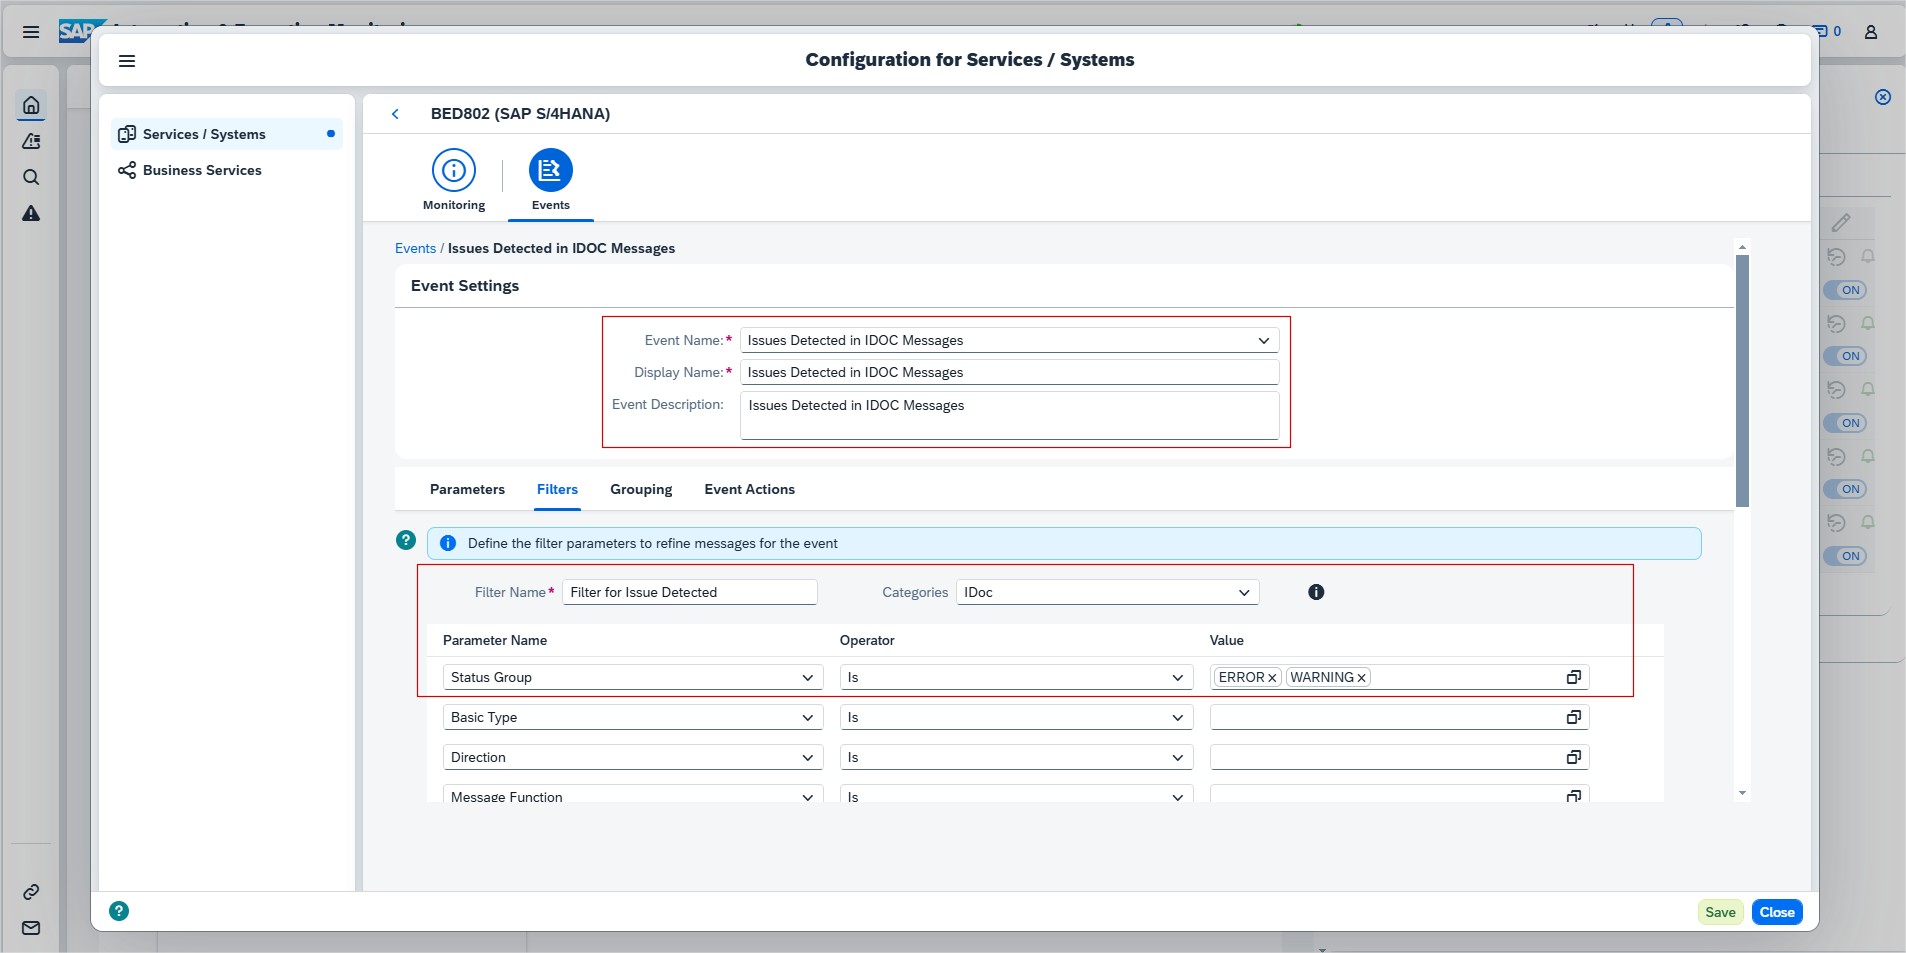
A new event type, Issues Detected, is introduced. This event type enables to configure events based on status group, status, direction, or any other filter parameter available for the message category.
For instance, it’s possible to setup events for warning messages from a particular interface by specifying the Status and Sender Interface parameters.
The event conditions are defined in the Filters section of the Event Settings. By default, ERROR and WARNING are selected for the Status Group parameter.
A new version of the Raw Data Outbound Logs API is now available for Integration & Exception Monitoring. This version uses a new payload structure that eases message processing for open telemetry.
Administration
Landscape Management had improvements for Access Control.
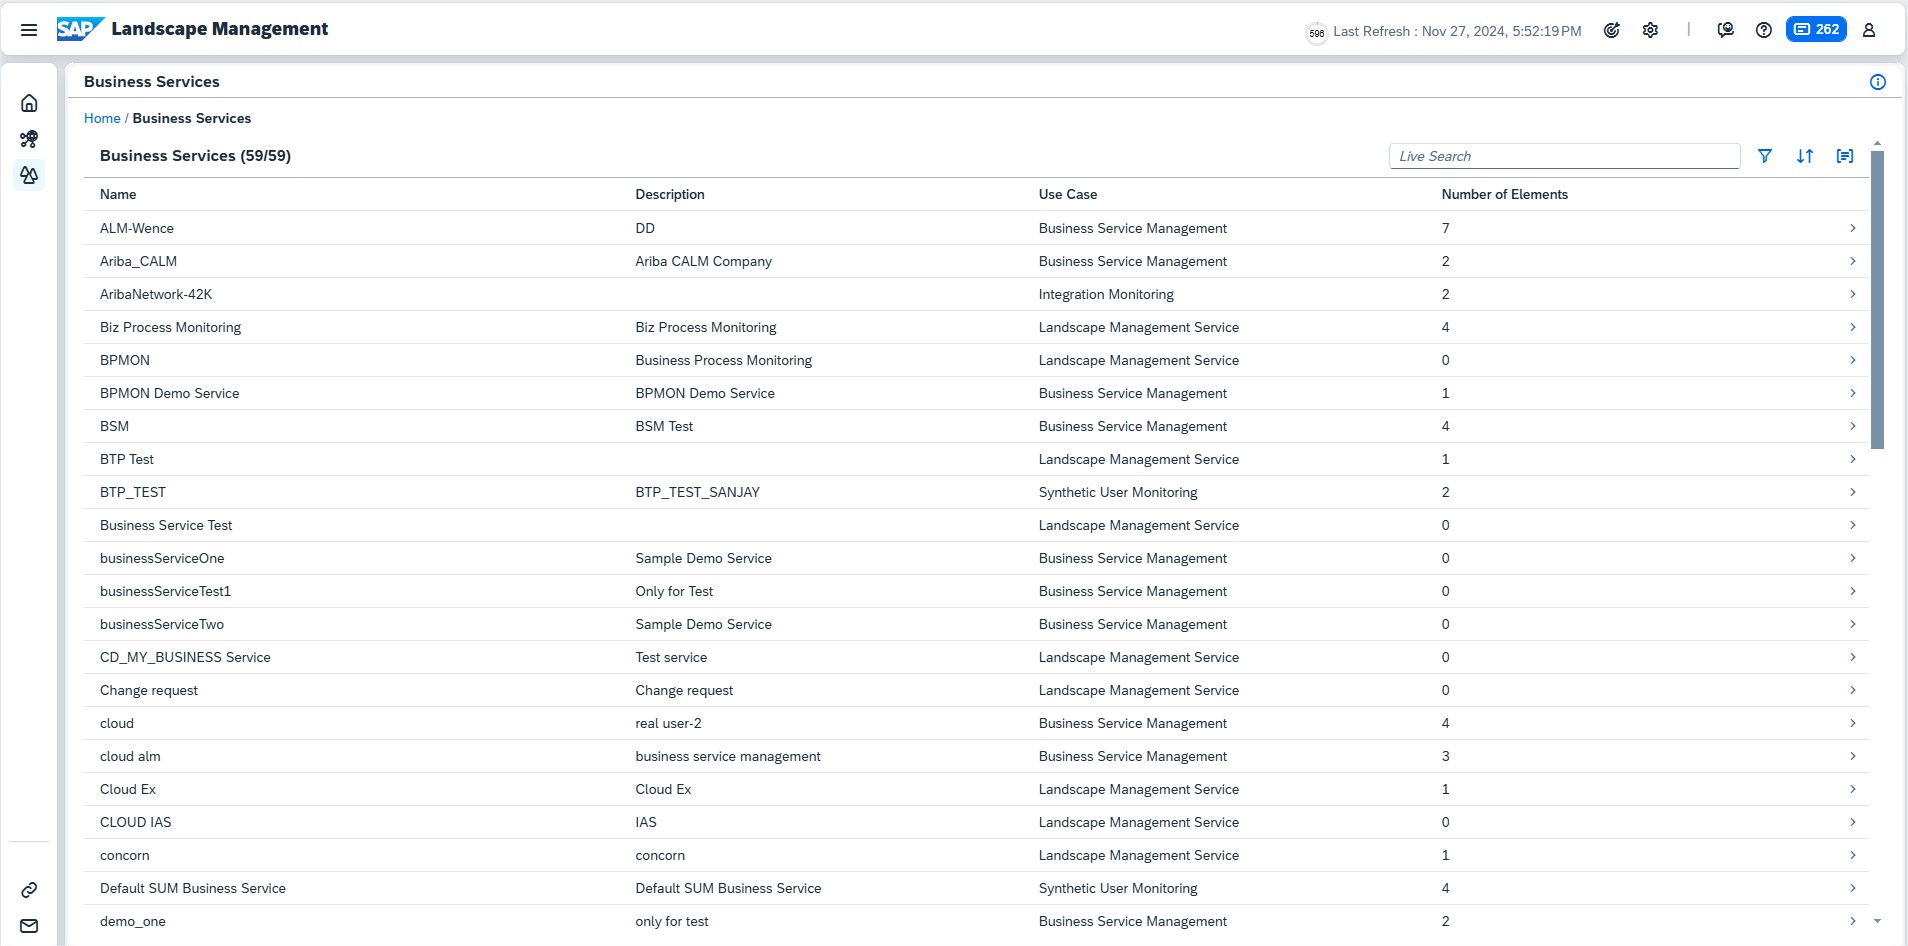
In the detail page of a business service, the assigned services and systems are displayed. Now, these names only link to the corresponding detail page, if user have access to the component by Access Control.
In the detail page of a managed component, the business services of this component are displayed. Only business services that users have access based on Access Control are listed there.
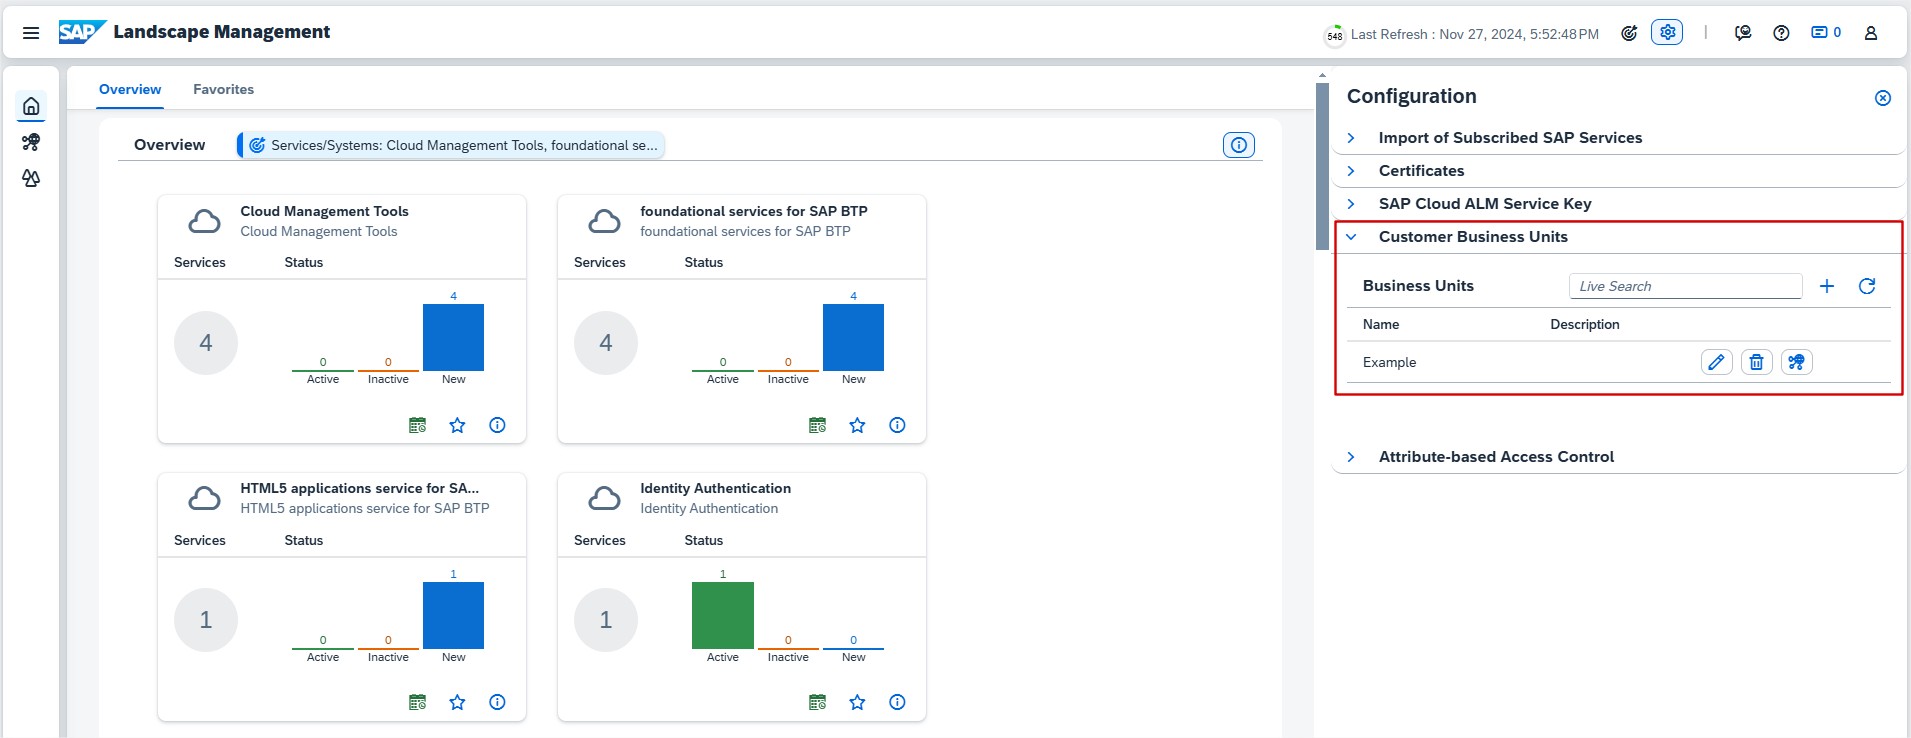
Landscape Management introduced also a new feature, Business Units.
It’s now possible to use business units as an additional grouping criterion for managed components to maintain a better overview of systems and services. It’s possible to assign one or more business units to a system or service. Users with Landscape Security Administrator role, can create, edit and delete business units in the Configuration section Customer Business Units.
This feature is particularly useful for a better overview if having a large number of systems and services under the same customer number. Depending on which grouping criterion is most helpful for grouping managed components, it’s also possible to specify any other values, such as departments, brands or locations.
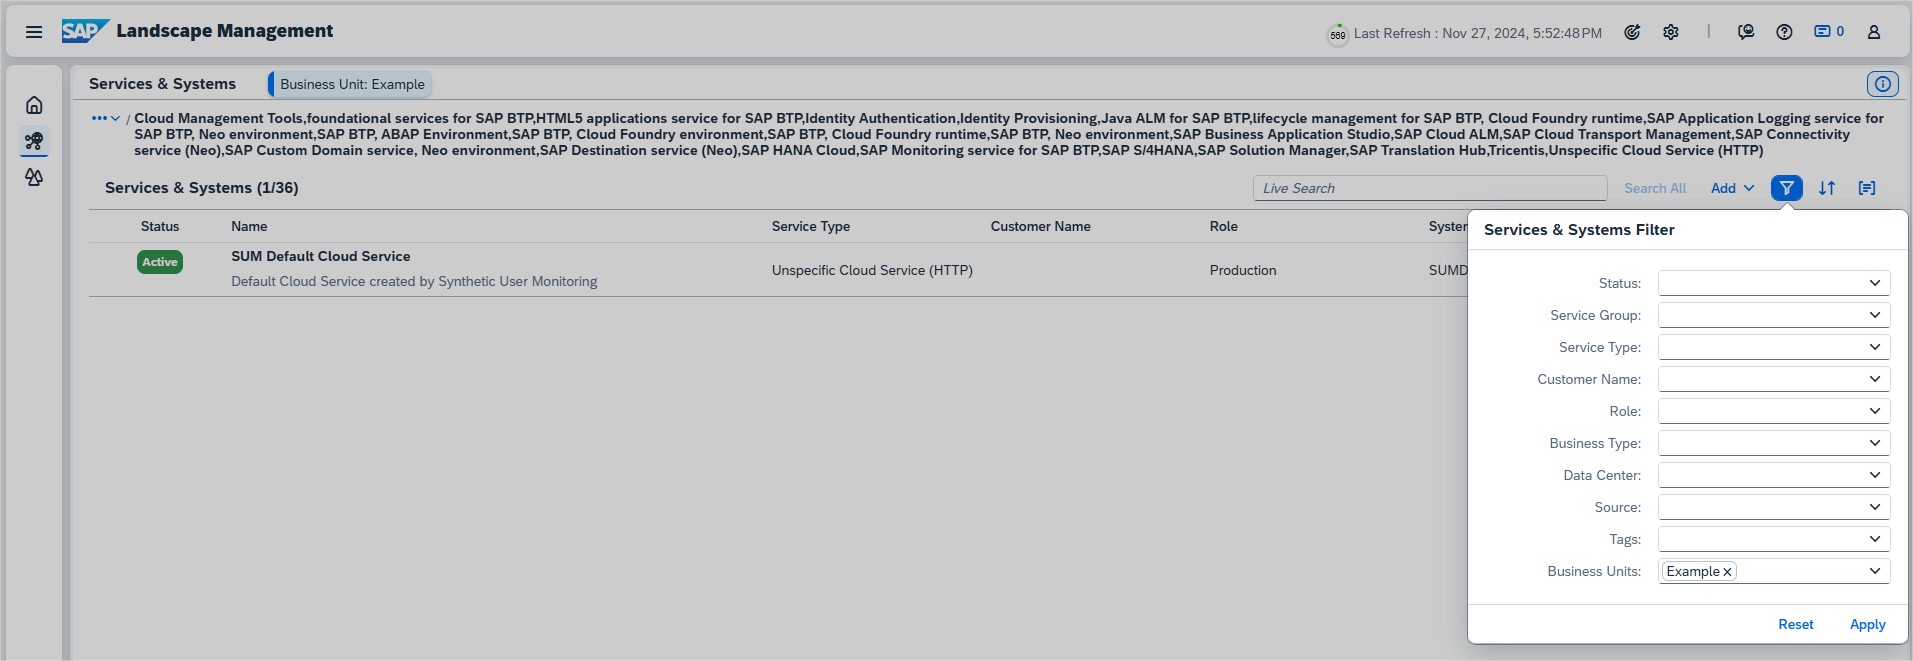
Once created, enables to filter services and systems list for any business unit, also the business units assigned to a service or system are displayed in the corresponding details.
In today’s digital landscape, understanding how users interact with applications is essential to improving performance and enhancing user experience. For organizations using SAP systems, Real User Monitoring within SAP Cloud ALM for Operations provides powerful insights into the behavior, performance, and usage patterns of end-users, whether they are accessing applications in the cloud or on-premise.
This tool is particularly valuable for IT and business users seeking to optimize application performance and boost user satisfaction.
It allows organizations to track and analyze user requests within managed SAP environments, where it monitors and records user interactions, capturing data on performance, response times, and overall application usage. By gathering this information, Real User Monitoring offers a window into the user’s experience, showing how frequently applications are accessed and how responsive they are during use.
Let’s explore the application and examine the features it offers.
Overview
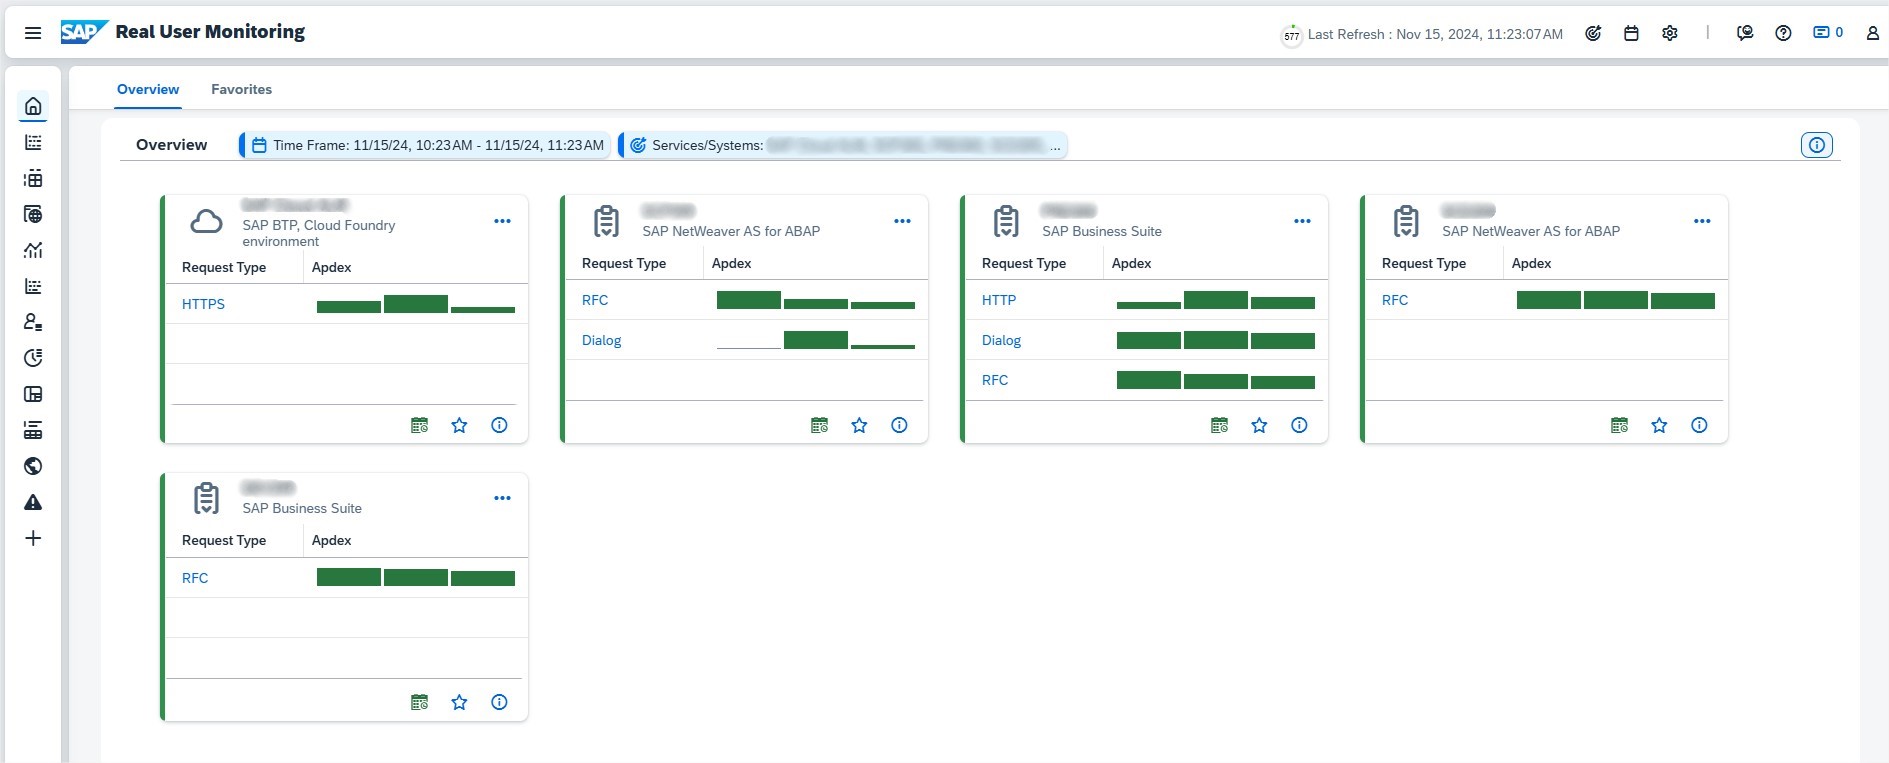
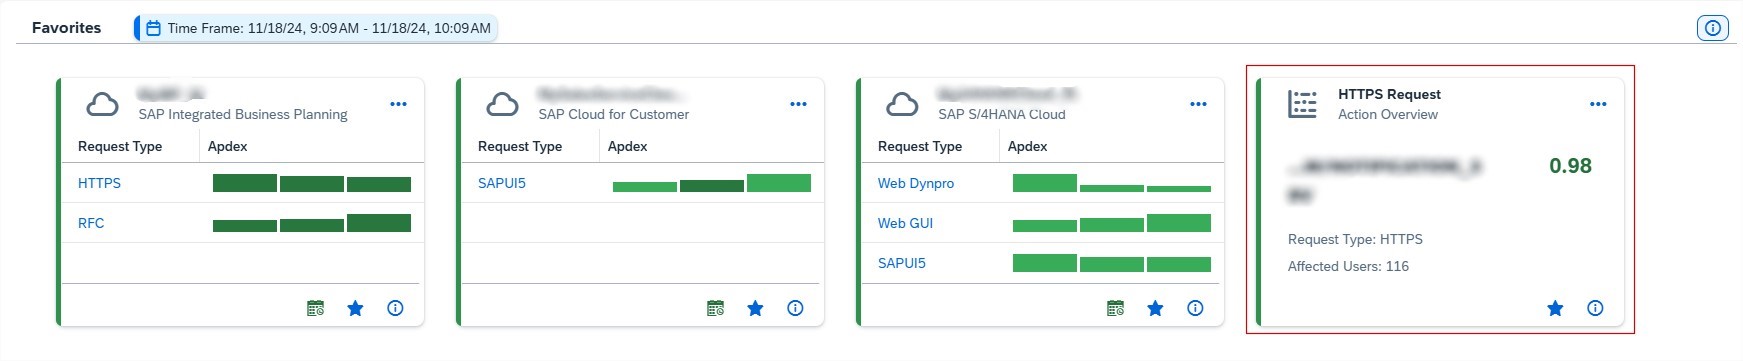
In the overview section of Real User Monitoring, you’ll find a clear visualization of the services selected within the defined scope, ranked by decreasing criticality. The data displayed is aligned with the chosen time frame, providing a focused snapshot of performance trends.
Each tile highlights the evolution of the Application Performance Index (Apdex) over time for the three most critical request types of a single service, with the service name and type prominently displayed in the tile header.
The bars within each request type provide additional insights: their size represents the number of executions, while their color indicates the Apdex rating. Hovering over a bar reveals a tooltip with detailed information, including the start time, Apdex value, and execution count.
On the left side of the tile, a visual indicator reflects the average service rating based on the displayed request types, providing an at-a-glance assessment of overall service performance.
Requests
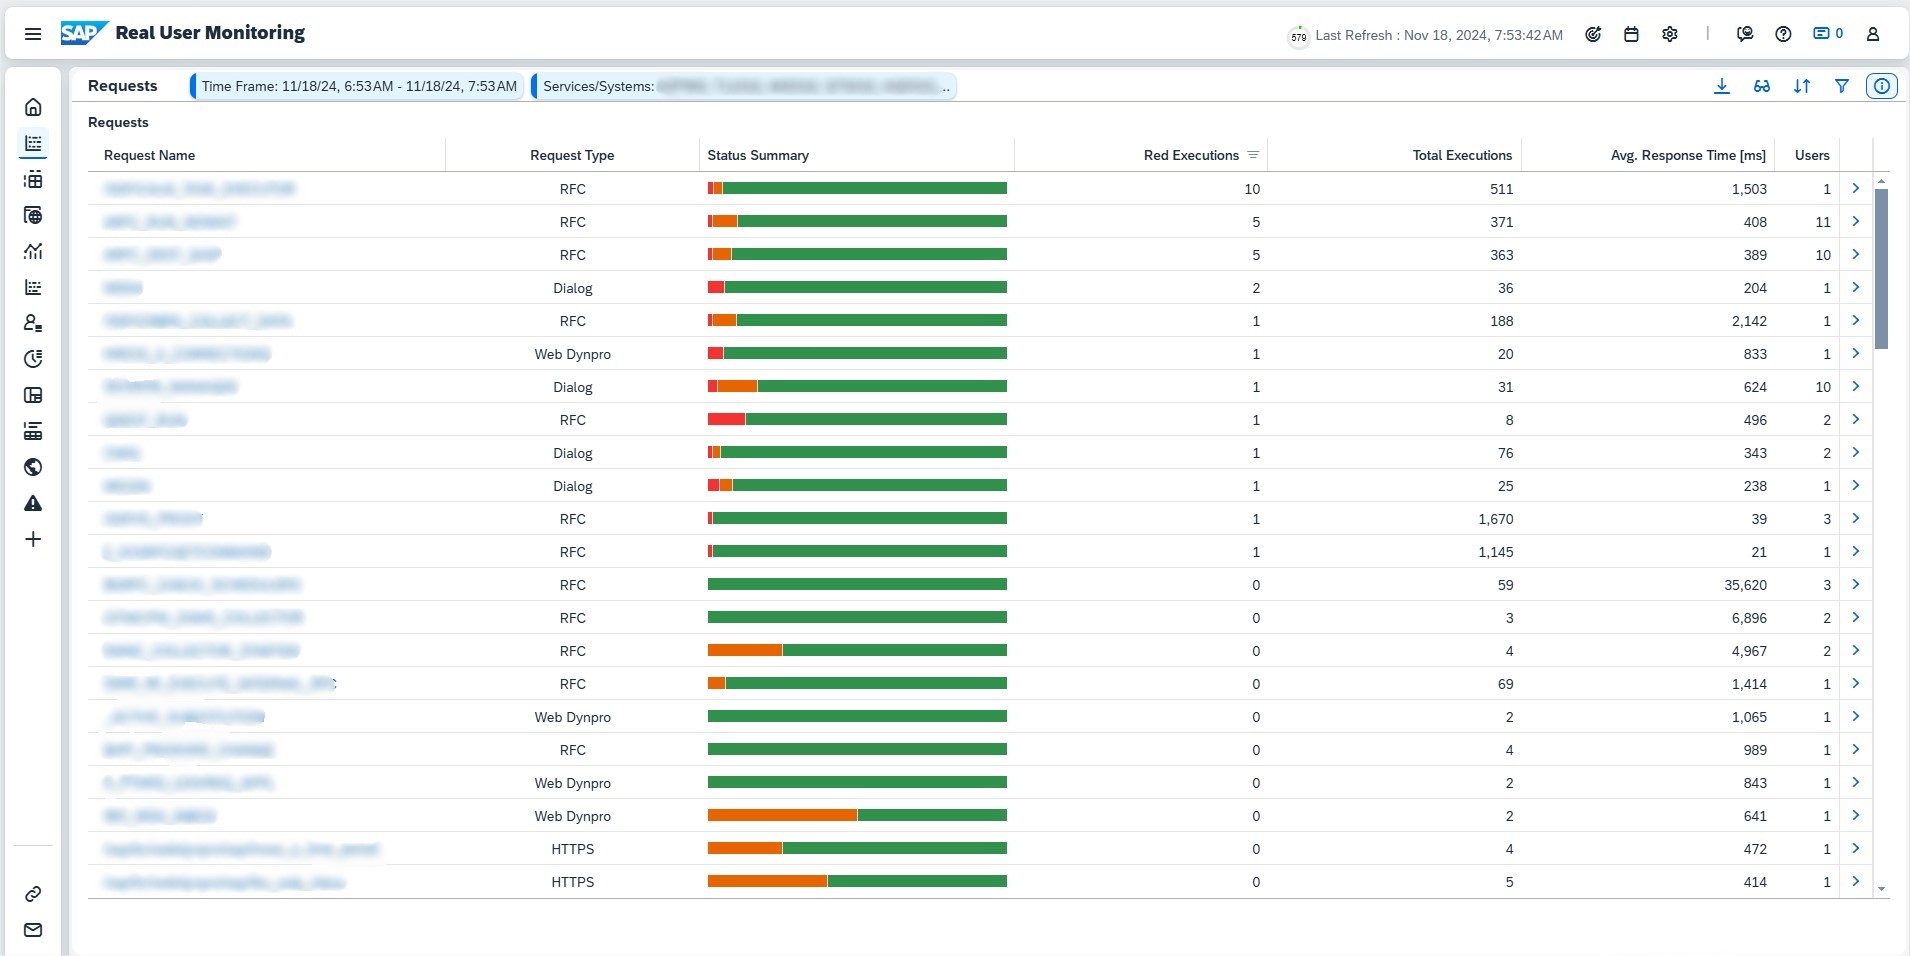
For each request, you can easily view key details, including its name and type, status (Critical, Warning, or OK), execution frequency, average response time, and the number of associated users. By default, the list is sorted by the number of critical executions (marked in red), ensuring the most urgent issues are prioritized.
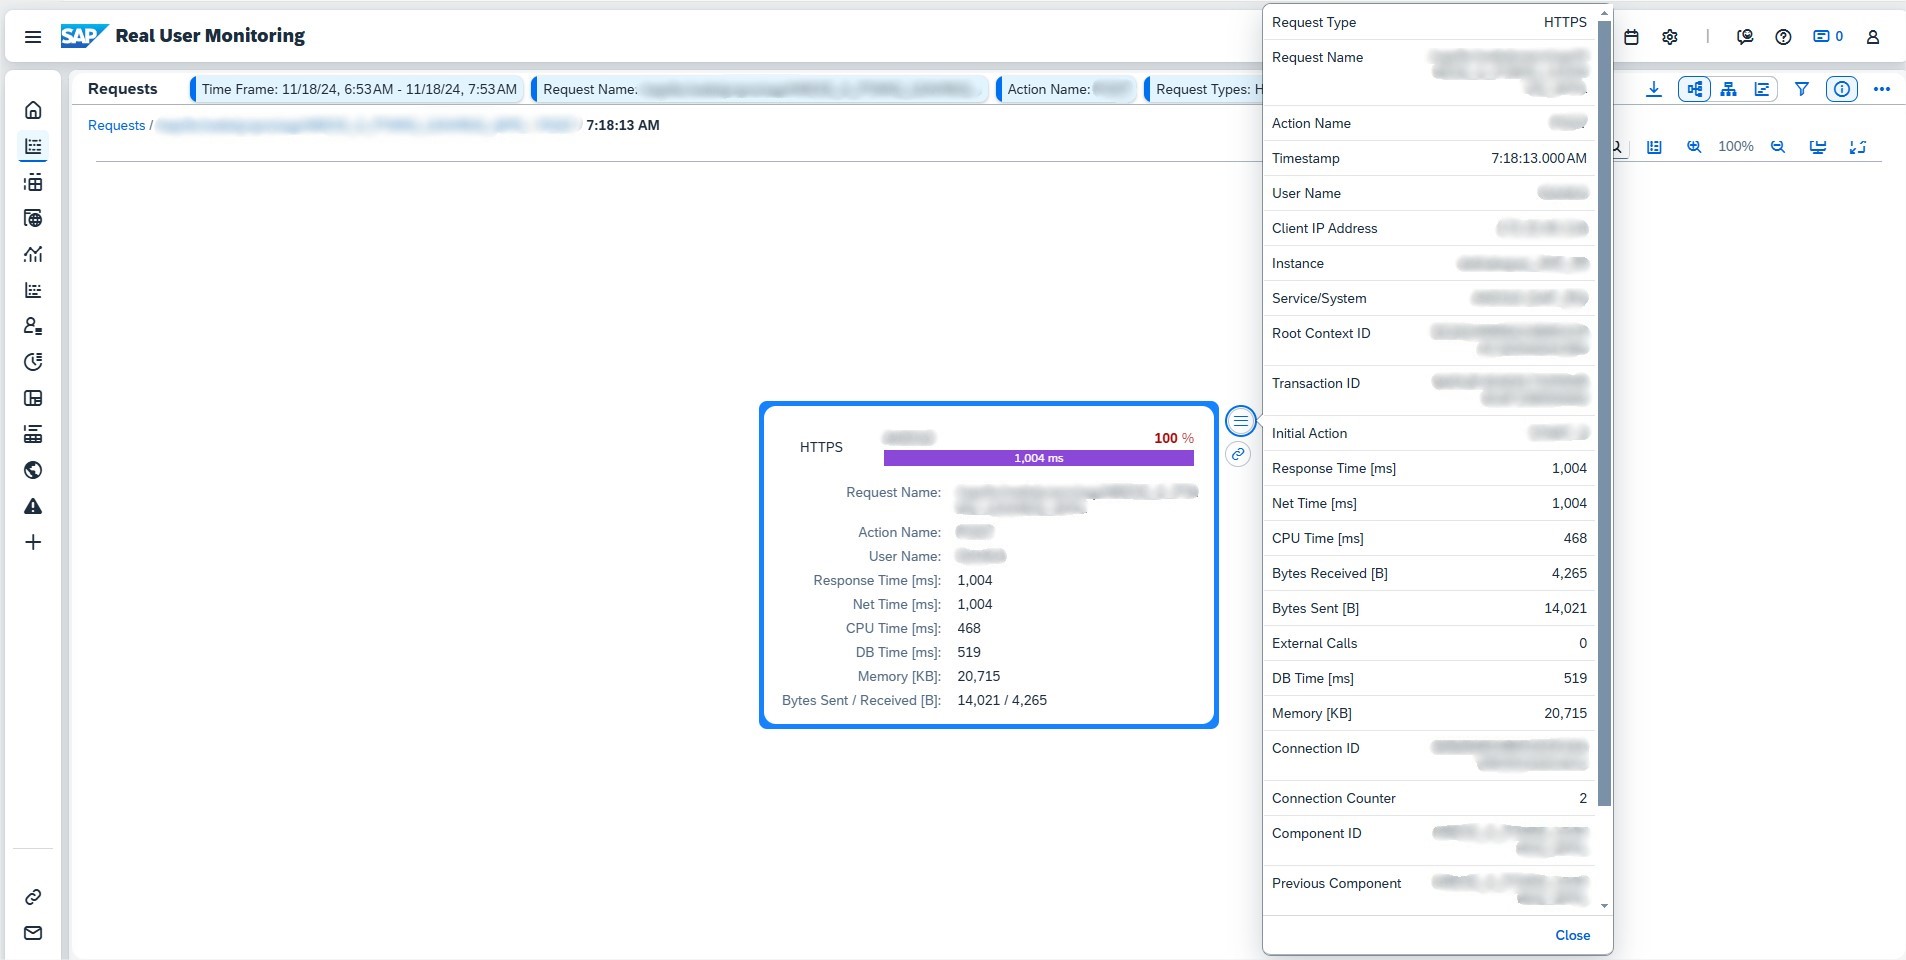
Clicking the Details icon beside a request opens three deeper levels of insights:
Request Actions: Actions are categorized based on the request type, such as HTTP(S) methods like GET or POST, SAPUI5 actions triggered by UI elements, Web Dynpro events, Web GUI interactions, or RFC function groups.
Execution Analysis: View execution patterns during the selected timeframe. A low net time for critical rows indicates the issue may lie outside the current service, requiring further investigation.
Execution Details: This level provides a granular look at a single execution, including correlated requests from other components. You can also choose from different visualizations to tailor the analysis to your needs.
The request status color is tied to response times:
Critical (Red): Response time exceeds the median by at least twice the standard deviation.
Warning (Yellow): Response time exceeds the median by at least one standard deviation.
These detailed insights help identify performance bottlenecks and drive focused troubleshooting efforts.
Analysis
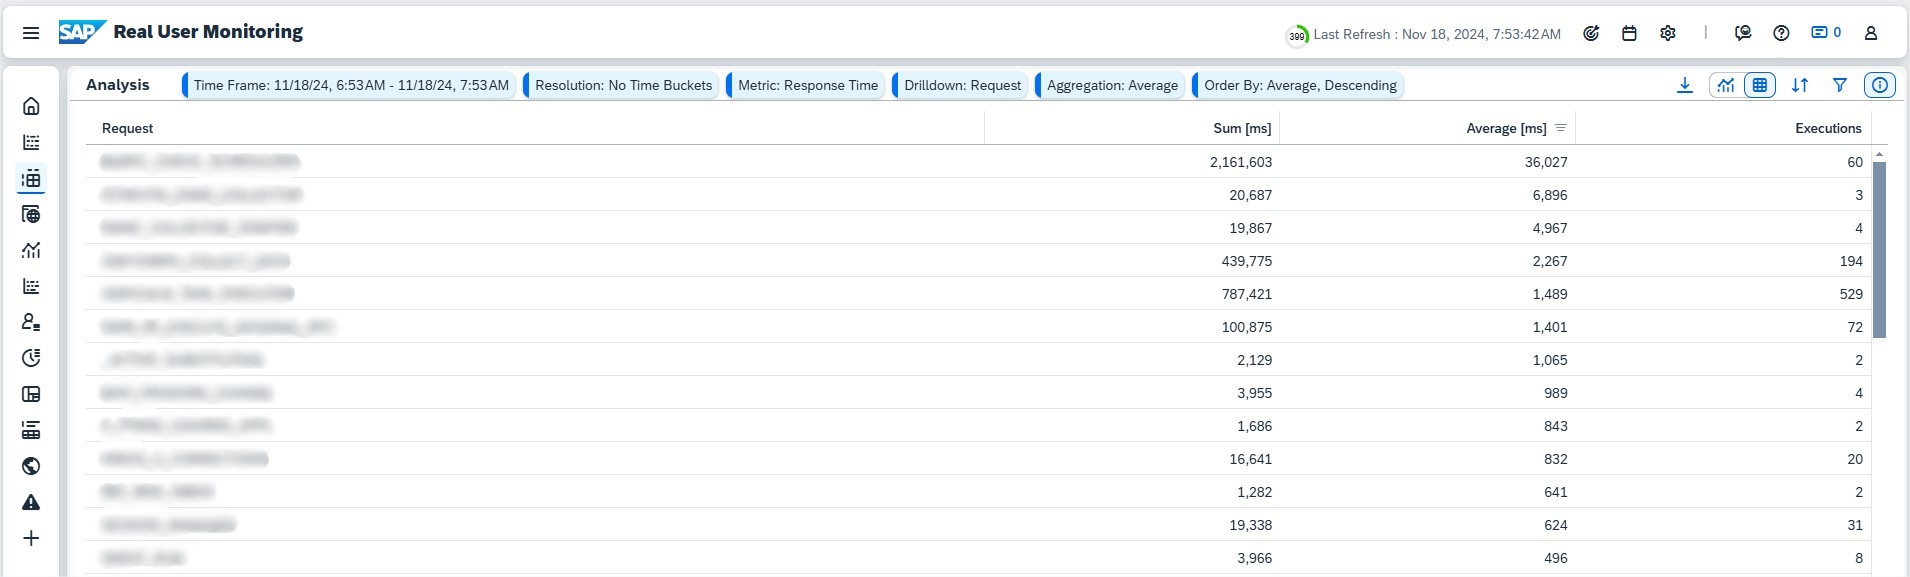
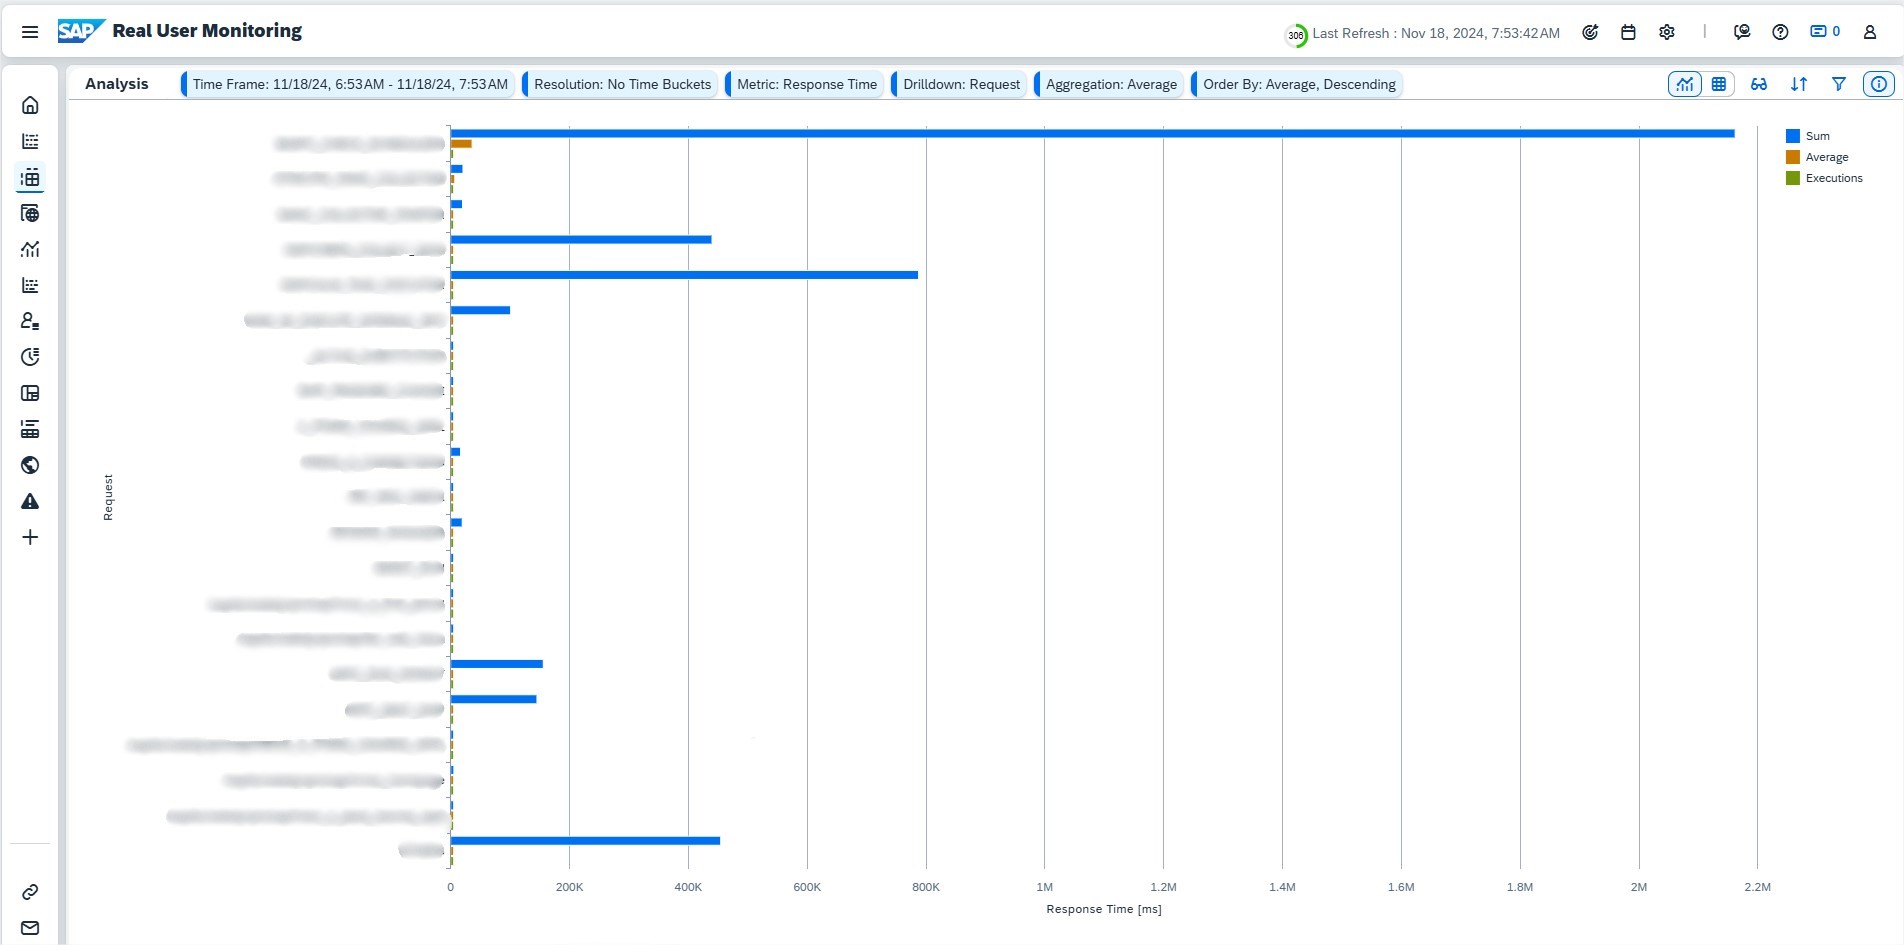
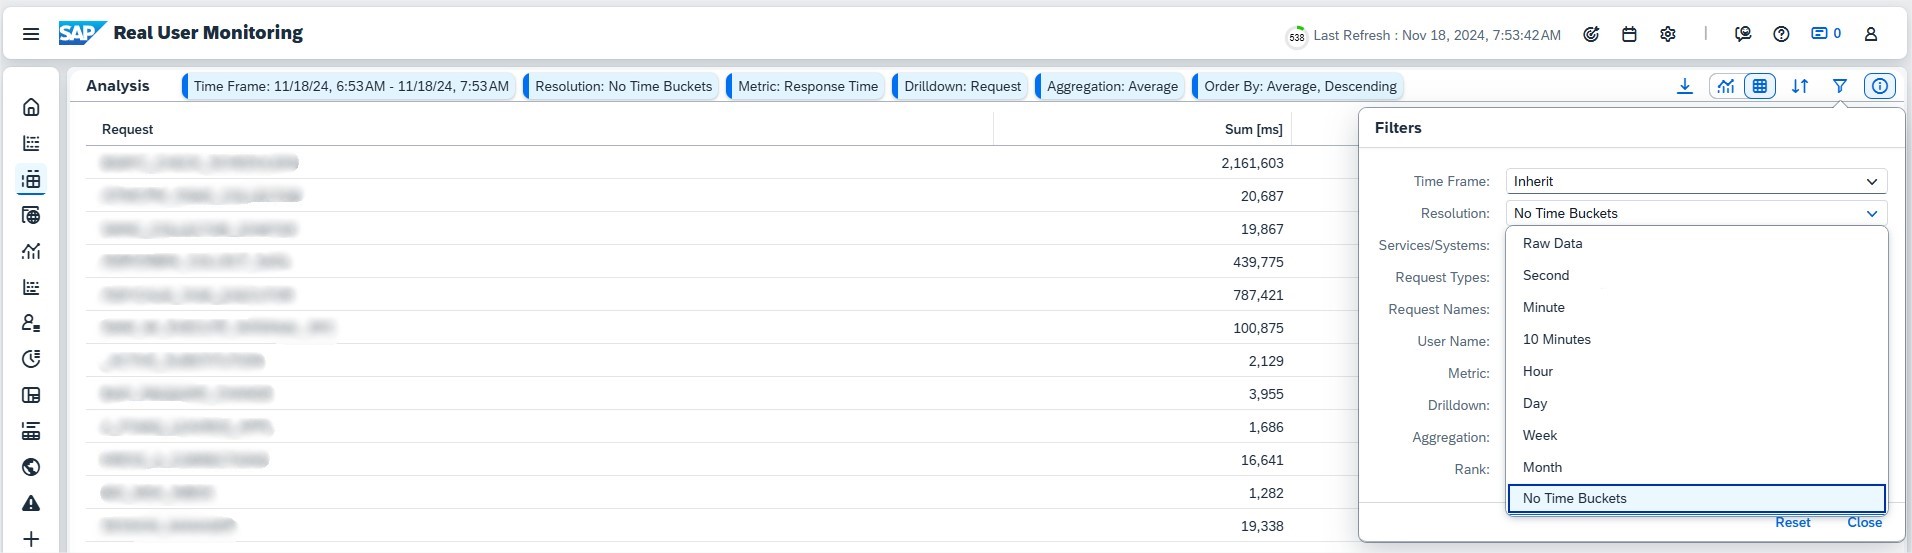
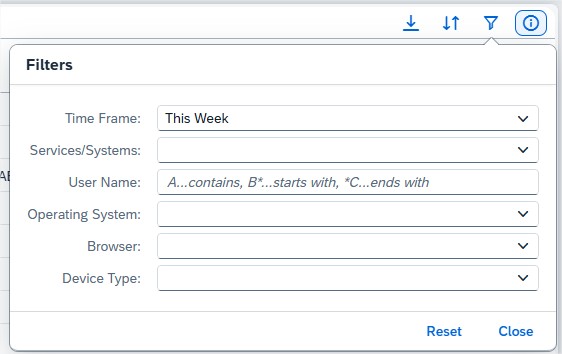
The Analysis page provides powerful tools to break down request metrics across various dimensions, offering a wide range of customizable analysis options. You can fine-tune the display settings using the Filter popover to focus on the data most relevant to your needs.
The Analysis page supports two primary display formats:
Table View
Use the Drilldown control to select dimensions displayed as columns, reorder them via drag-and-drop, and sort using the Sort option.
Choose a single metric—Sum, Average, or Count—to focus your analysis.
Ideal for detailed, tabular comparisons across dimensions.
Chart View
Best for visualizing trends over time.
Select a Resolution and Time Frame to generate line charts showing metric development.
For non-temporal analysis, set Resolution to “No Time Buckets” to create horizontal bar charts.
The Drilldown control lets you activate and arrange dimensions, which define table columns or chart categories. Metrics calculations include:
Sum: The total of all request values.
Average: The sum divided by the count.
Count: The total number of requests.
For time-specific breakdowns, choose a time resolution in Resolution.
The Analysis page delivers a flexible, dimension-based view of request metrics, making it easy to uncover trends and actionable insights tailored to your operational needs.
Front End
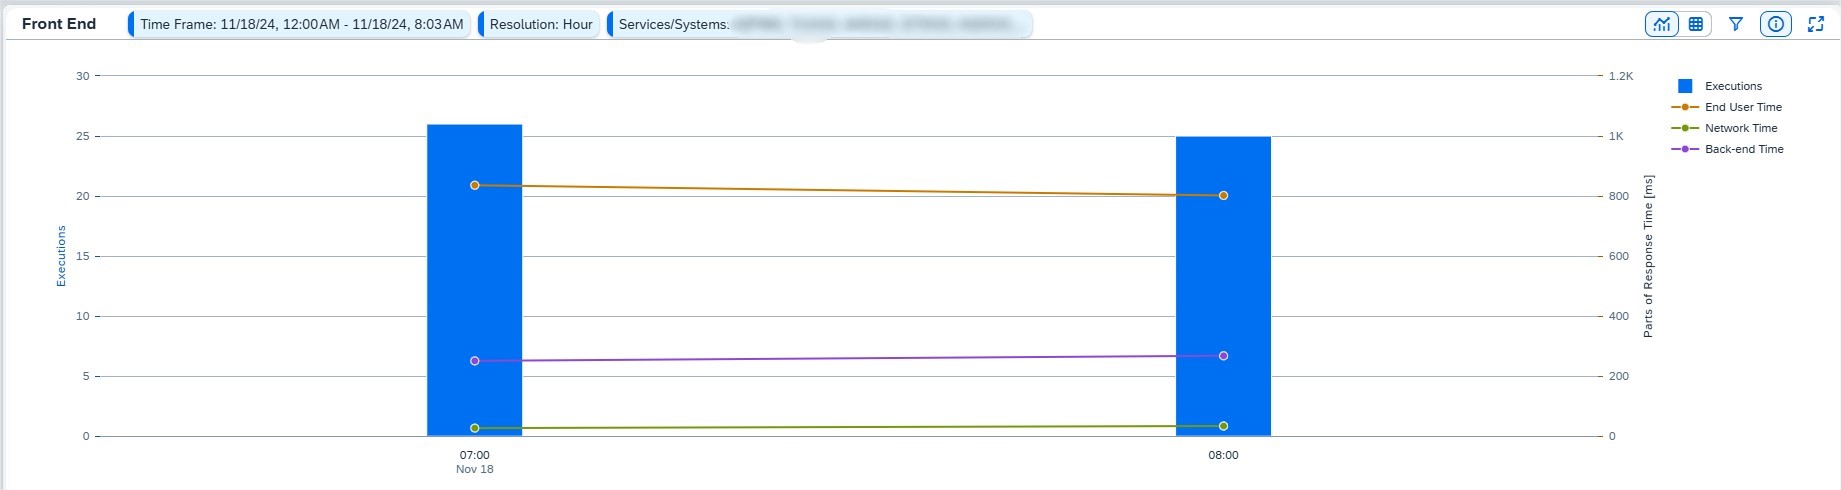
The Front End page offers key usage and performance metrics for front-end request types like SAPUI5, Web Dynpro, and Web GUI. This section provides a detailed view of how applications perform from the end-user perspective, helping you identify and address potential bottlenecks.
The Front End section includes the following metrics:
Executions: Total number of requests executed within the selected period.
End User Time: Response time experienced by the user.
Network Time: Time spent in network roundtrips between the front end and server.
Back-End Time: Processing time on the server.
You can visualize these metrics as a Chart or a Table, adjusting the display using the Filter option to select specific requests, time frames, and resolution levels.
By default, metrics are shown for the current week with an hourly resolution, independent of global time frame settings. To align this page with global settings, select Inherit in the Filter popover.
The OS & Browsers section provides an overview of operating systems, browsers, and devices used by end-users, along with their respective user counts. Depending on the Display Version setting in the filter:
User counts are shown by browser and OS types (e.g., Windows, Chrome).
Alternatively, they are broken down by specific versions (e.g., Windows 10).
Clicking on a segment in the pie charts reveals individual users for a selected OS or browser. User data is anonymized if the viewer lacks the Real User Analyst Sensitive role, ensuring sensitive information remains protected.
The Front End page delivers actionable insights into user behavior and performance, enabling proactive measures to enhance the overall experience.
Back End
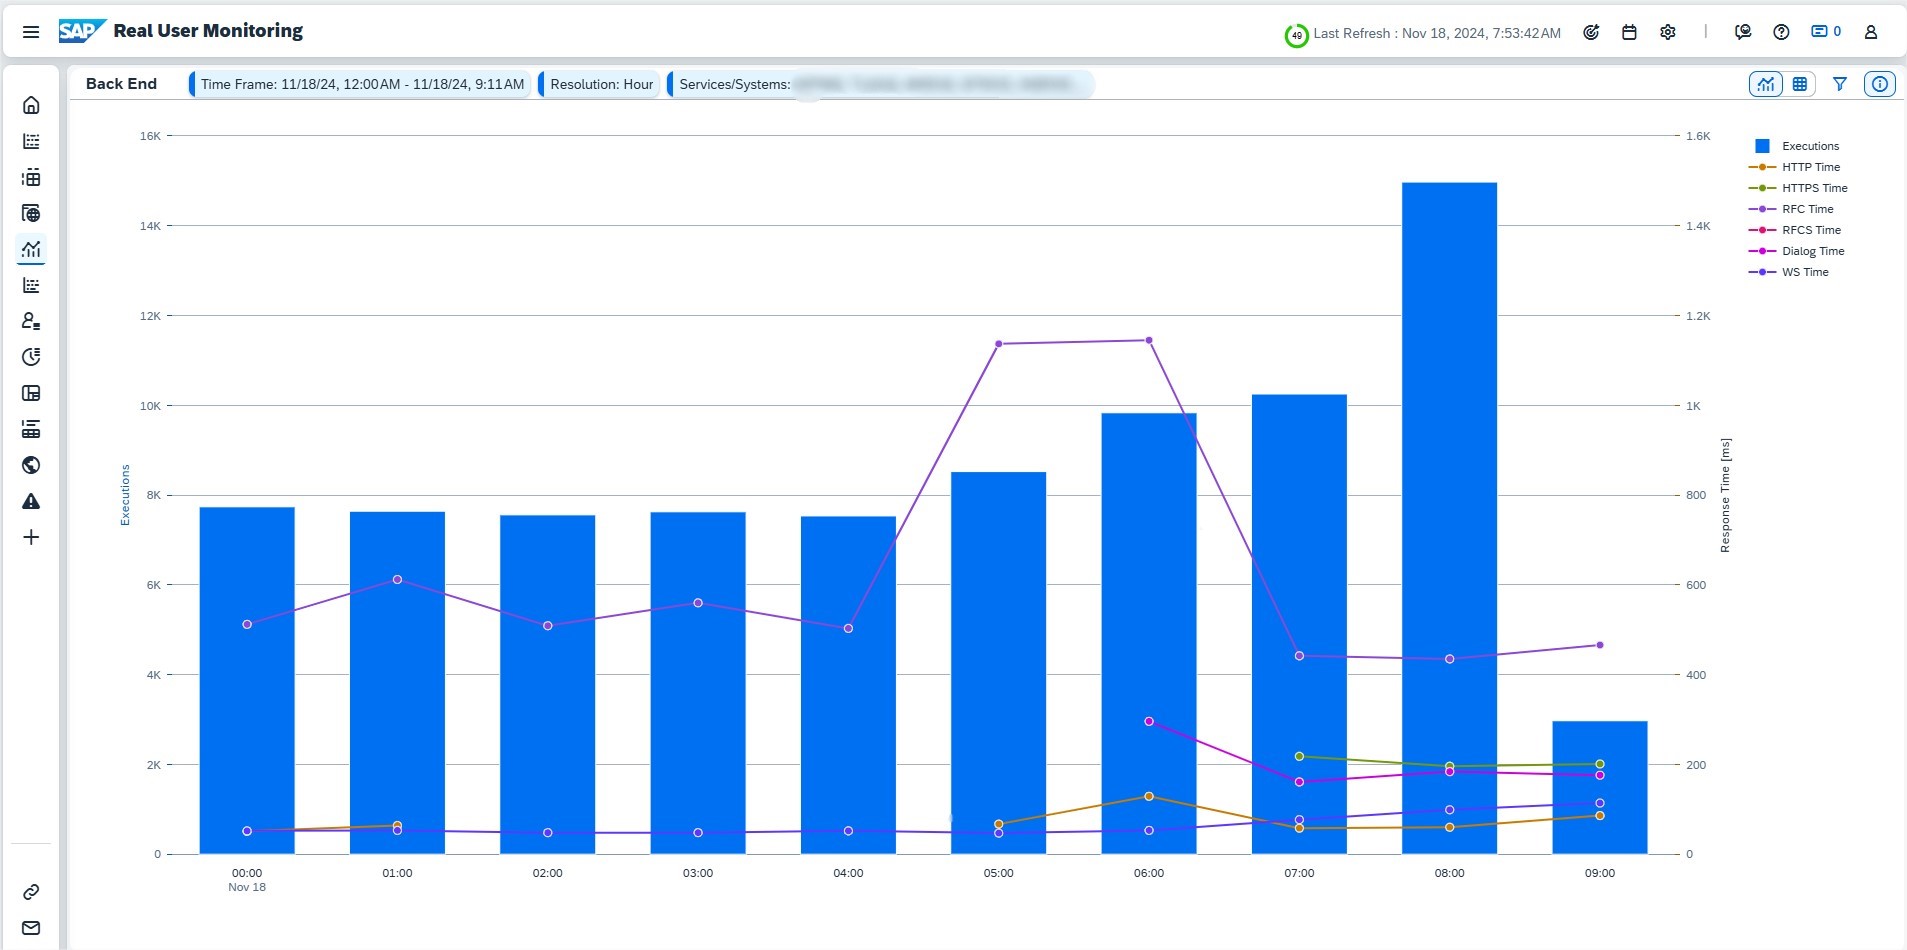
The Back End page provides an essential overview of performance and usage metrics for back-end requests, helping you monitor and optimize system performance.
By default, the page shows response times and execution counts for these back-end request types:
HTTP
HTTPS
RFC
RFCS
Dialog
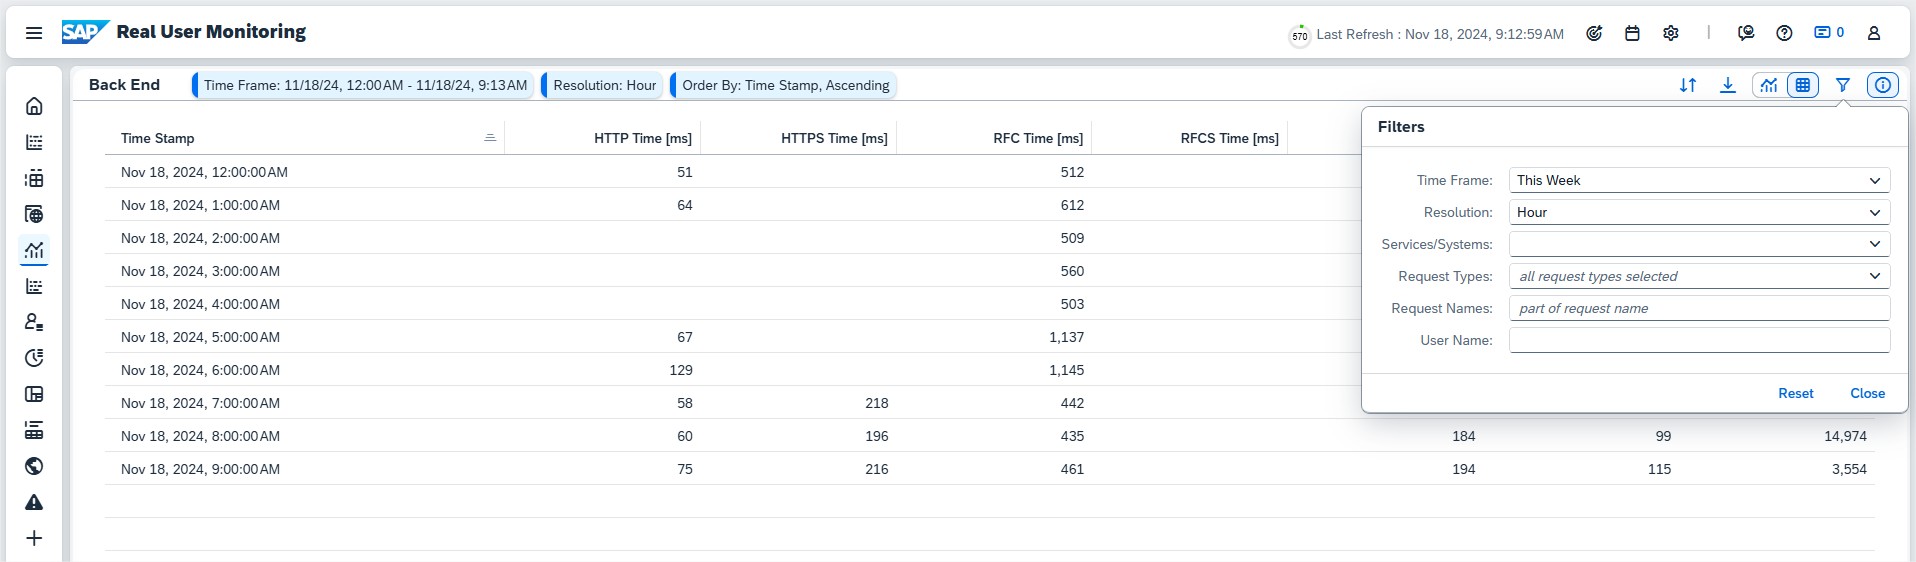
Metrics can be displayed as a Chart or Table, and the Filter option allows you to refine the view by selecting specific requests, time frames, and resolutions. If you have the Real User Analyst Sensitive role, you can also filter data by specific users for deeper insights.
By default, metrics from the current week are displayed with an hourly resolution. This setting is independent of the global time frame. To align with global settings, choose Inherit in the Filter popup.
Services/Systems
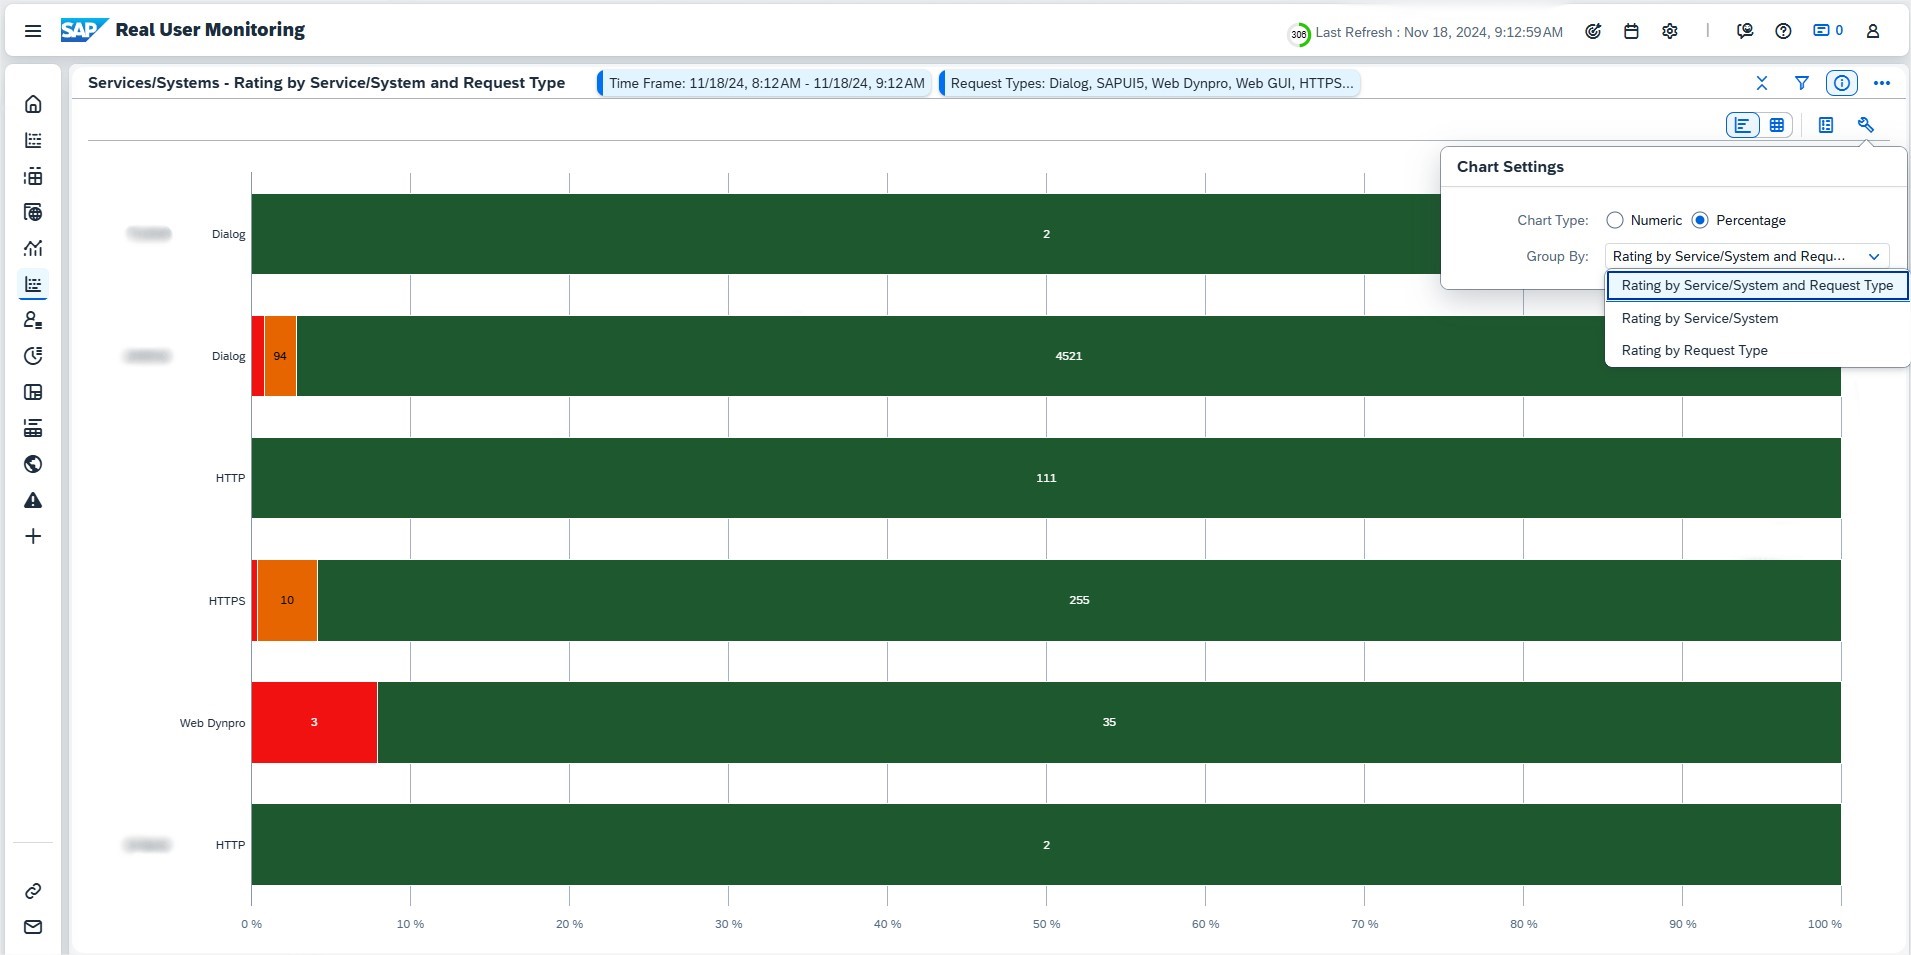
The Services/Systems page provides an overview of request performance grouped by services and systems, making it easy to identify entities with poor performance or high request volumes.
Key Features:
View ratings for each service/system and request type.
Identify how many requests are executed for a particular request type and determine which service handles the highest volume.
If one entity dominates, you can display values as percentages by expanding the toolbar and selecting Chart Settings.
The status color of requests reflects their response times:
Critical (Red): Response time exceeds the median by at least twice the standard deviation.
Warning (Yellow): Response time exceeds the median by at least one standard deviation.
The Services/Systems page helps you pinpoint performance issues and better understand how services handle request loads, enabling targeted improvements.
Clients
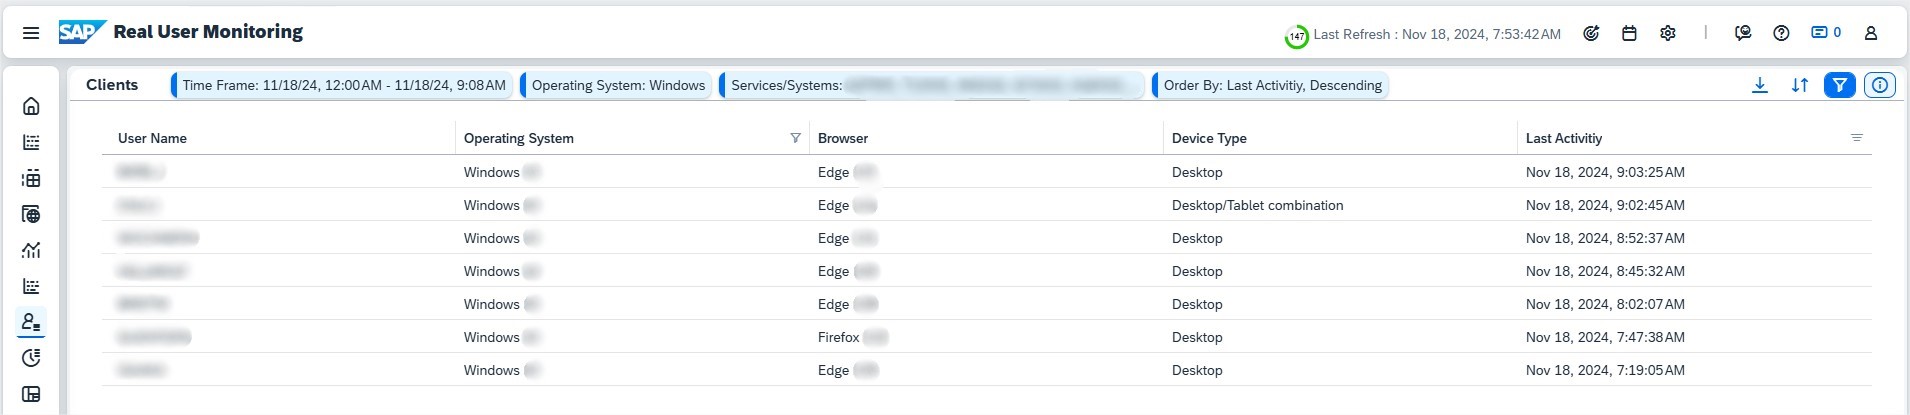
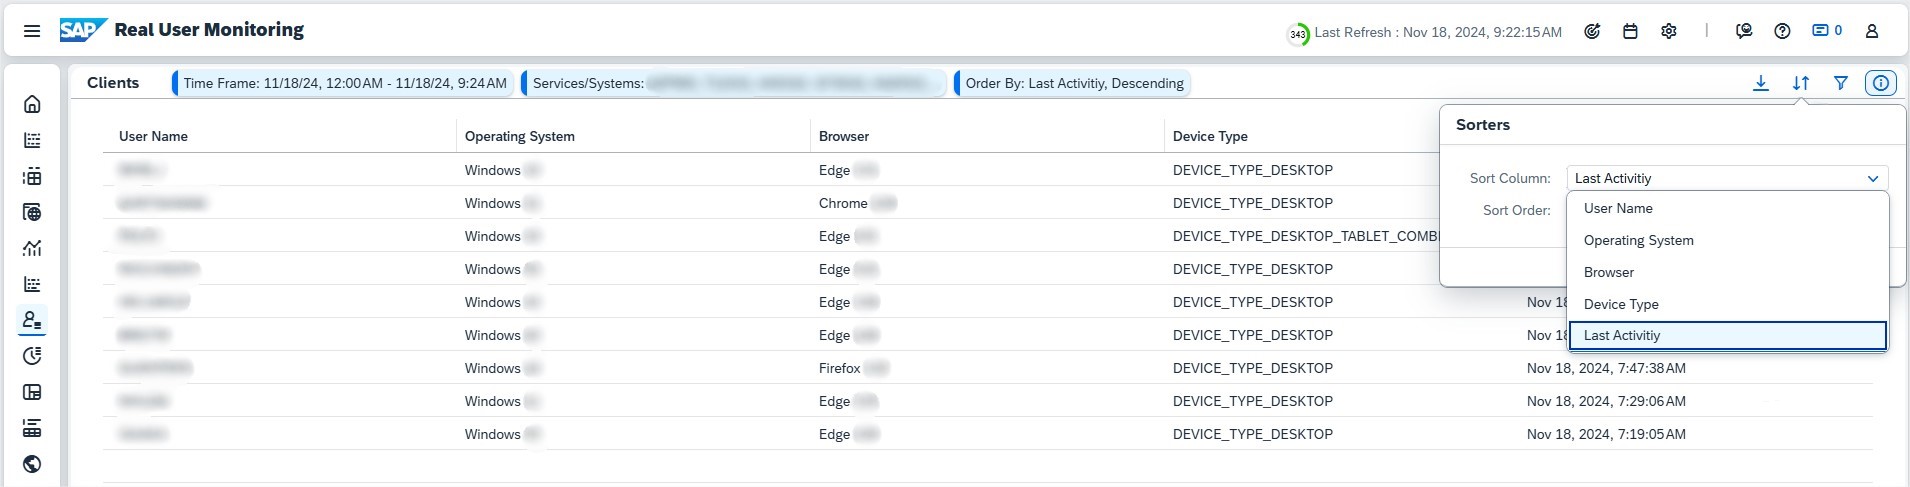
The Clients page provides detailed information about the operating systems, browsers, and device types used by users for the following front-end request types:
SAPUI5
Web Dynpro
Web GUI
Key Features
Gain insights into the technologies your users rely on, categorized by OS, browser, and device type.
For an overview of user counts, refer to the OS & Browsers section on the Front End page.
If you lack the Real User Analyst Sensitive role, user names are anonymized to ensure data privacy.
Filtering Options
Use the general Filter to refine data by operating system, browser, and device type (e.g., Windows or Chrome).
For version-specific filtering (e.g., Windows 10), use the filter option in the corresponding table column.
The Clients page offers valuable insights into user environments, helping you understand usage patterns and optimize for a diverse range of devices and platforms.
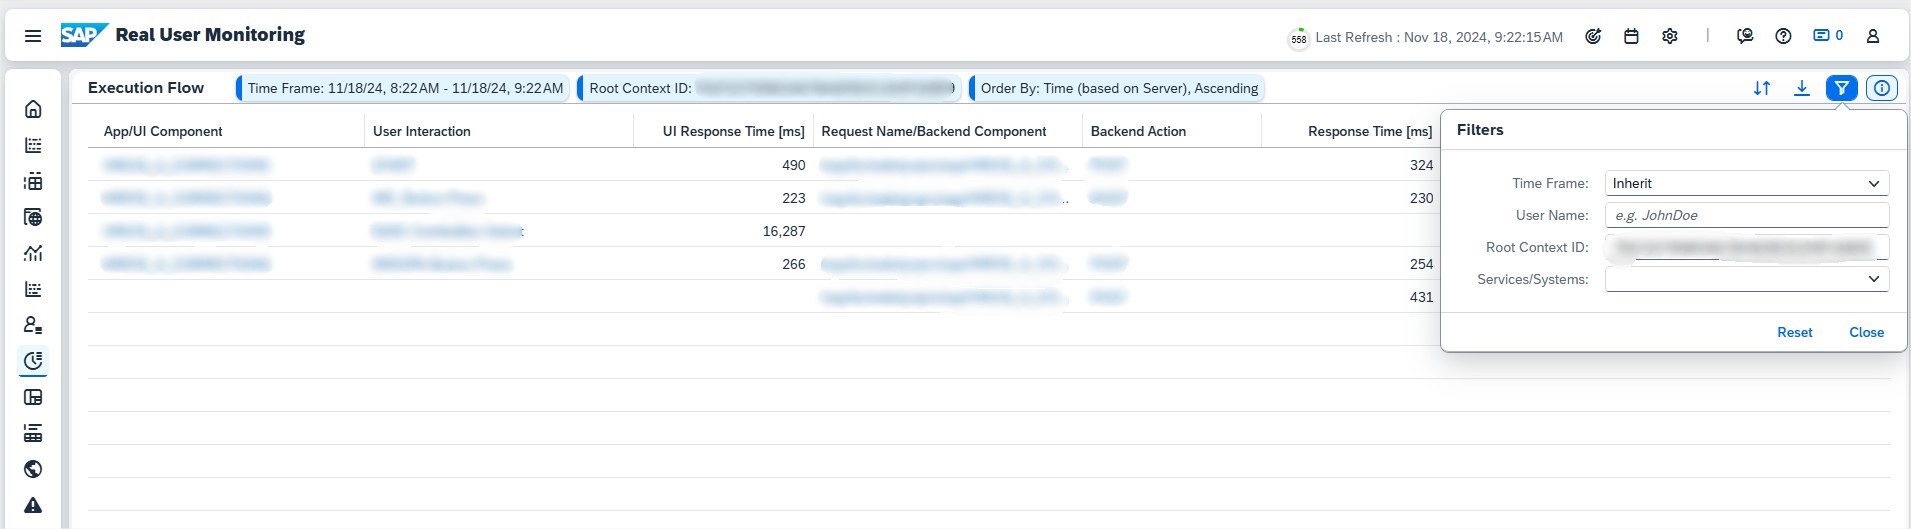
Execution Flow
The Execution Flow page offers a chronological view of user actions and corresponding system responses, enabling you to analyze usage patterns and pinpoint potential system issues.
By default, no data is displayed. To begin, provide a valid User Name or Root Context ID in the Filter:
The Root Context ID identifies a session, remaining consistent even when requests are sent to different servers, such as when launching an app from the SAP Fiori Launchpad.
If you lack the Real User Analyst Sensitive role, only the Root Context ID can be used, and user names will not be visible.
Once results are populated, activities with backend responses exceeding 200ms are detailed. Key columns include:
App/UI Component: Front-end application used.
User Interaction: Technical name of the user’s action.
UI Response Time [ms]: Time taken for the UI to respond.
Request Name/Backend Component: Server request triggered.
Backend Action: Operation performed on the server.
Response Time [ms]: Server processing time.
Net Time [ms]: Component’s gross processing time, excluding outgoing requests.
Time (based on Server): Timestamp of the action.
You can click on any component or action to navigate directly to the Requests page, applying relevant filter settings for a focused drilldown.
The Execution Flow page provides a comprehensive overview of user activities and backend processes, helping you track actions, assess performance, and investigate issues in real-time.
Expensive Requests
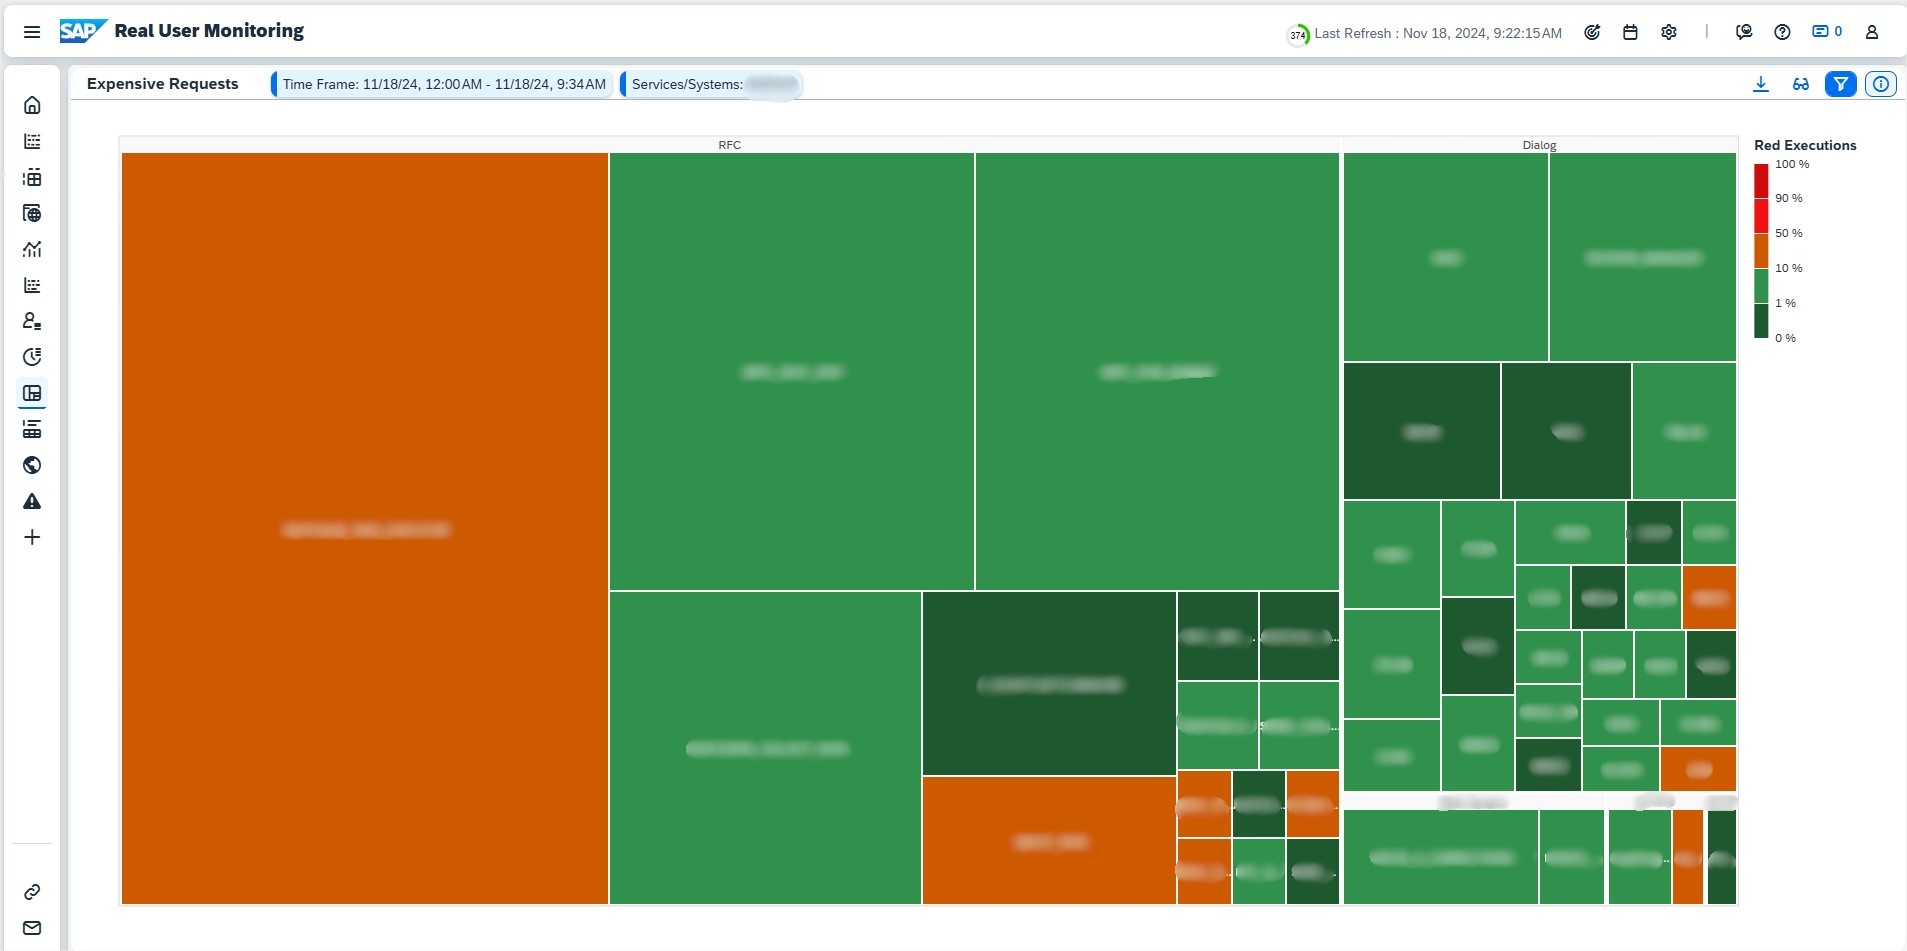
The Expensive Requests page highlights the most resource-intensive and critical request names across your services and systems, enabling you to identify potential bottlenecks and optimize performance.
Key Features
Displays up to 200 request names by default, ranked by resource consumption or criticality. You can adjust this limit in the Filters under the Top field.
Results appear as a tree map with squares representing request names, grouped by request types.
Tree Map Details
Square Size: Depends on the selected Display Mode.
Square Color: Reflects the percentage of “red” (critical) executions. A request is “red” if its response time is at least 12 times the median response time for its type. Color thresholds are shown in the legend.
Choose from three views in Display Mode:
Performance (Default): Highlights request names with the most red executions.
Workload: Focuses on requests with the highest total response time, calculated as the product of execution count and average response time.
Usage: Shows request names with the highest number of unique calls, representing the breadth of user activity.
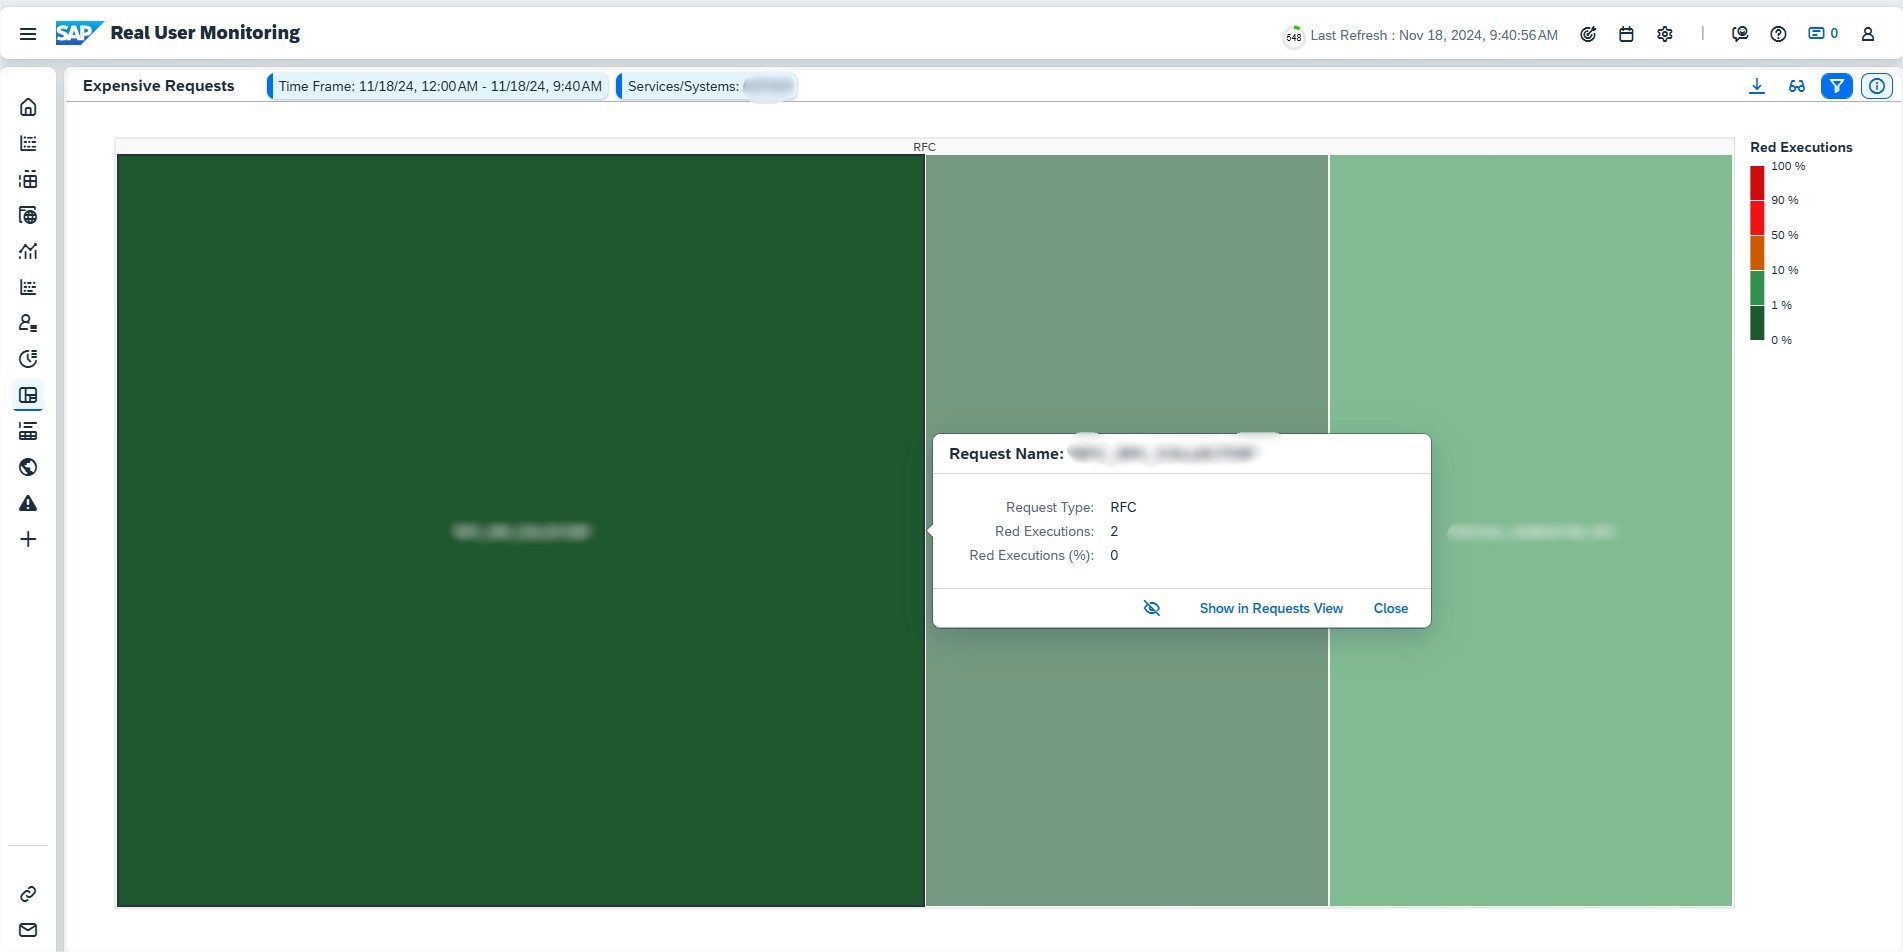
Click on any square to display the corresponding request name in the Request Overview. Also, you can click Hide to hide single dominating request names to have a better overview of the other request names. Hidden request names are displayed in the Filters with an exclamation point (!) as the prefix.
The Expensive Requests page offers a clear visual representation of resource-heavy requests, helping you prioritize optimizations and improve overall system efficiency.
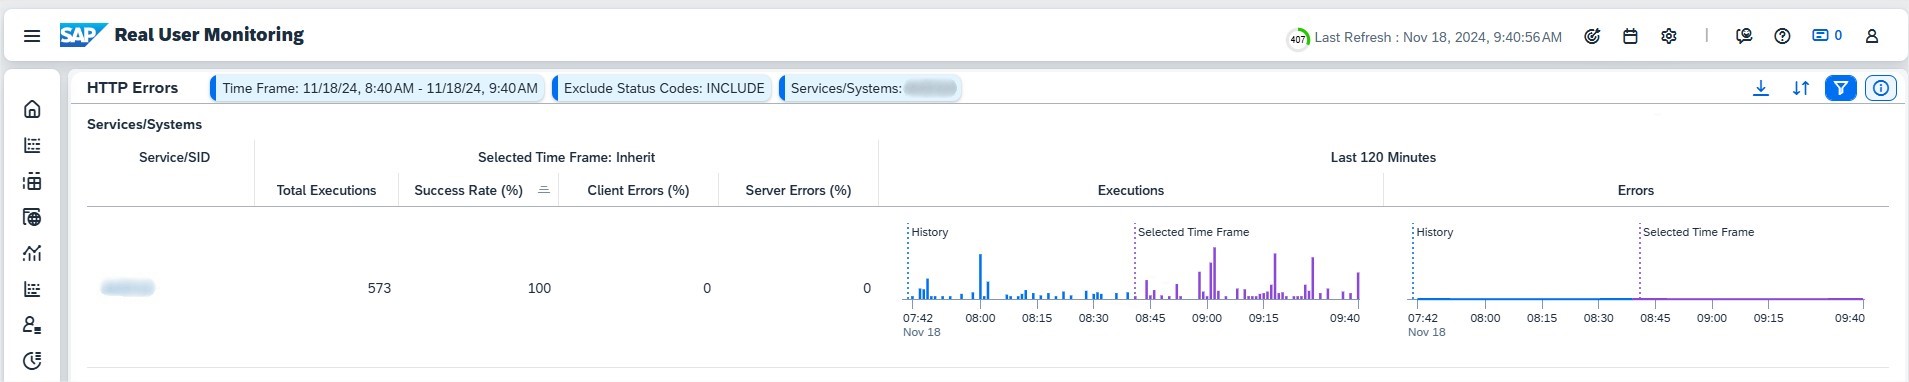
HTTP Errors
The HTTP Errors page provides insights into HTTP(S) request errors across systems and services, enabling quick identification of performance issues.
For each system or service within the selected time frame, the page shows:
Number of Executions: Total HTTP(S) requests executed.
Success Rate (%): Percentage of successful calls.
Client Errors (4xx): Percentage of calls with 4xx status codes.
Server Errors (5xx): Percentage of calls with 5xx status codes.
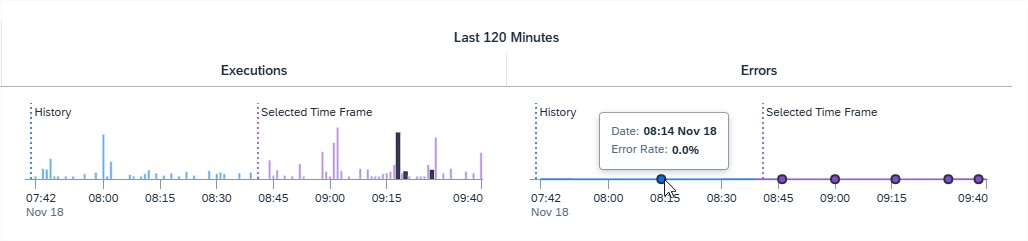
The History section visualizes the trend of HTTP(S) calls and errors over time. An extended period before the selected time frame is included in the charts for context, with the selected time frame highlighted in purple.
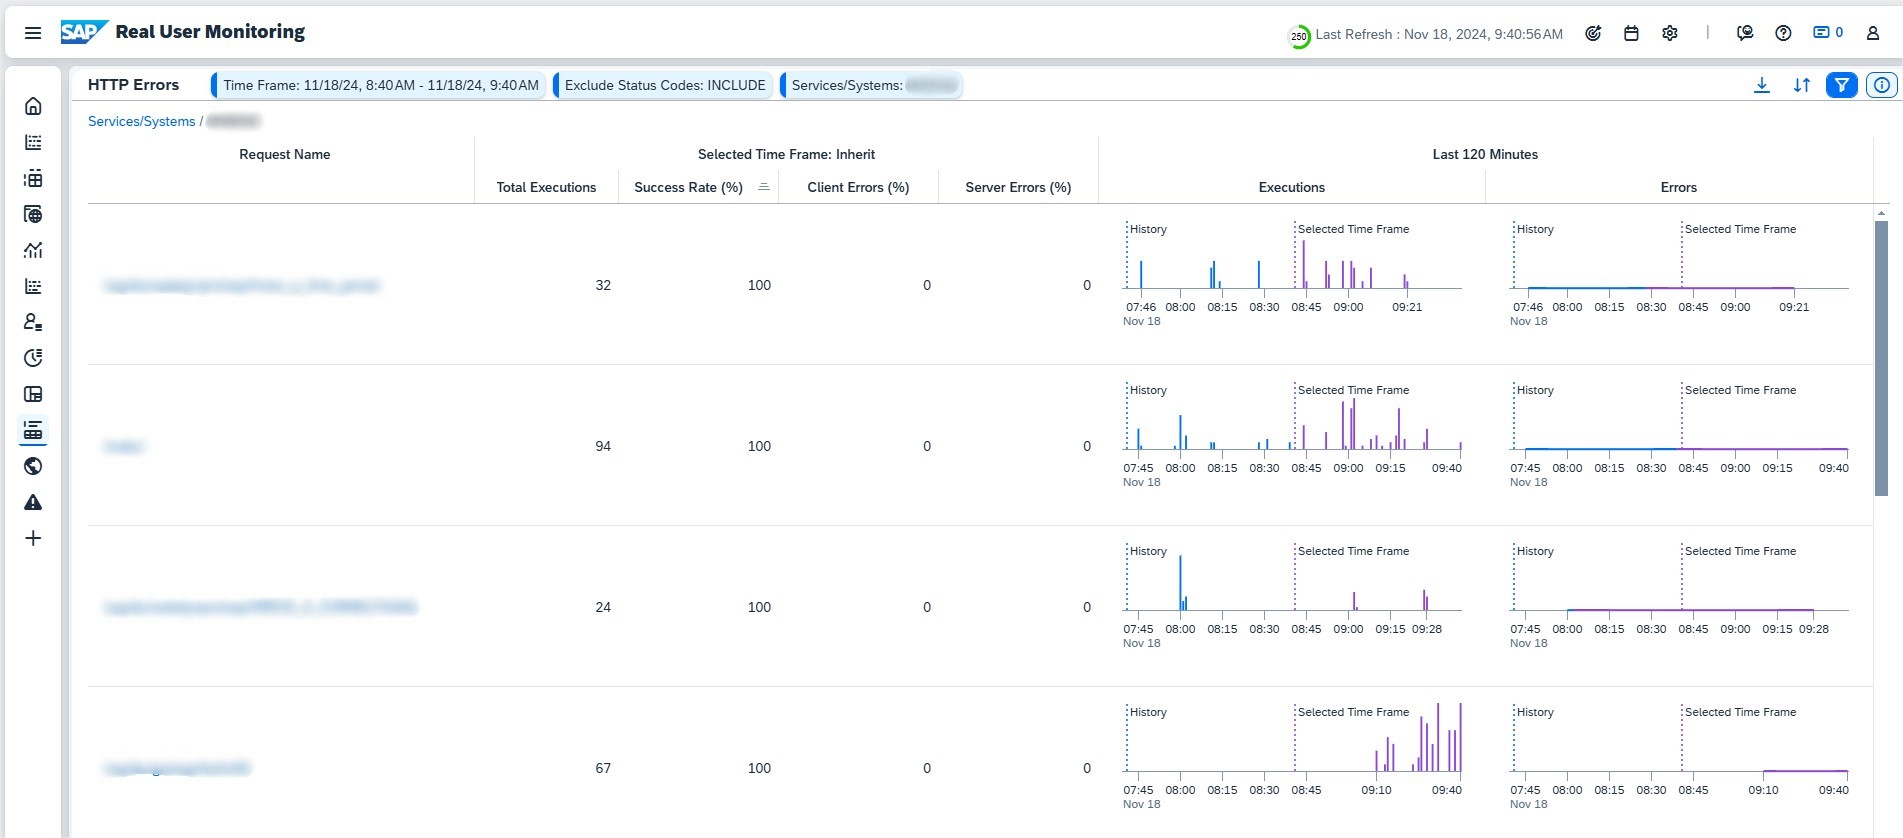
Click on a system or service in the table to view detailed data for the corresponding request names within the selected system or service.
The HTTP Errors page equips you with actionable insights to monitor error trends, troubleshoot issues, and ensure high system reliability.
Geolocation
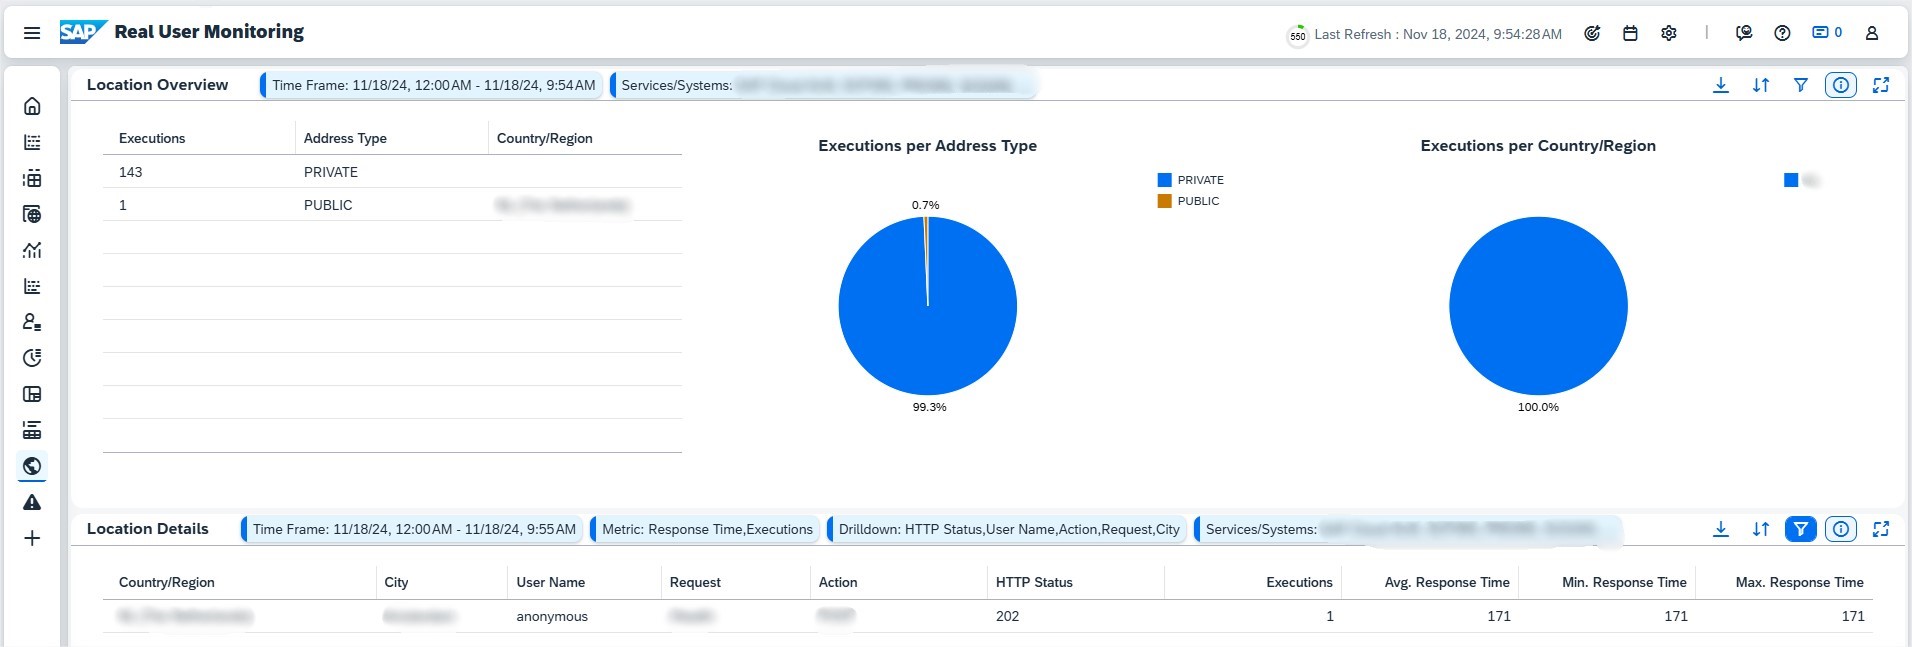
The Geolocation page allows you to analyze where HTTP(S) requests are originating from, offering insights into the geographical distribution of traffic for systems and services in scope.
Key Features
For public cloud services, the caller’s IP address is passed through to the application via X-Forwarded-For, making it possible to assign the IP address to a location. Note that users may alter this information using VPN tools.
Private cloud services and on-premise systems depend on the network infrastructure configuration to provide location data.
The Location Overview displays the number of requests grouped by country/region and IP address type, including:
PUBLIC: IP addresses passed through and assigned a location.
PRIVATE: No location data available for these IP ranges.
UNKNOWN: IP addresses that cannot be resolved to a location.
Drill down into specific location data by selecting a country/region from the overview or using the Filter to define a metric. You can explore the following criteria for deeper analysis:
City
Request Name
Action (HTTP method)
User Name
HTTP Status (status code)
The Geolocation page helps you visualize the global distribution of user activity, identify regional performance issues, and understand traffic patterns across different locations.
Alerting
The Alerting page provides an overview of all activated alerts, helping you monitor critical system events and take necessary actions.
Key Features
Alert Types: Currently, HTTP Errors are the primary alerts displayed.
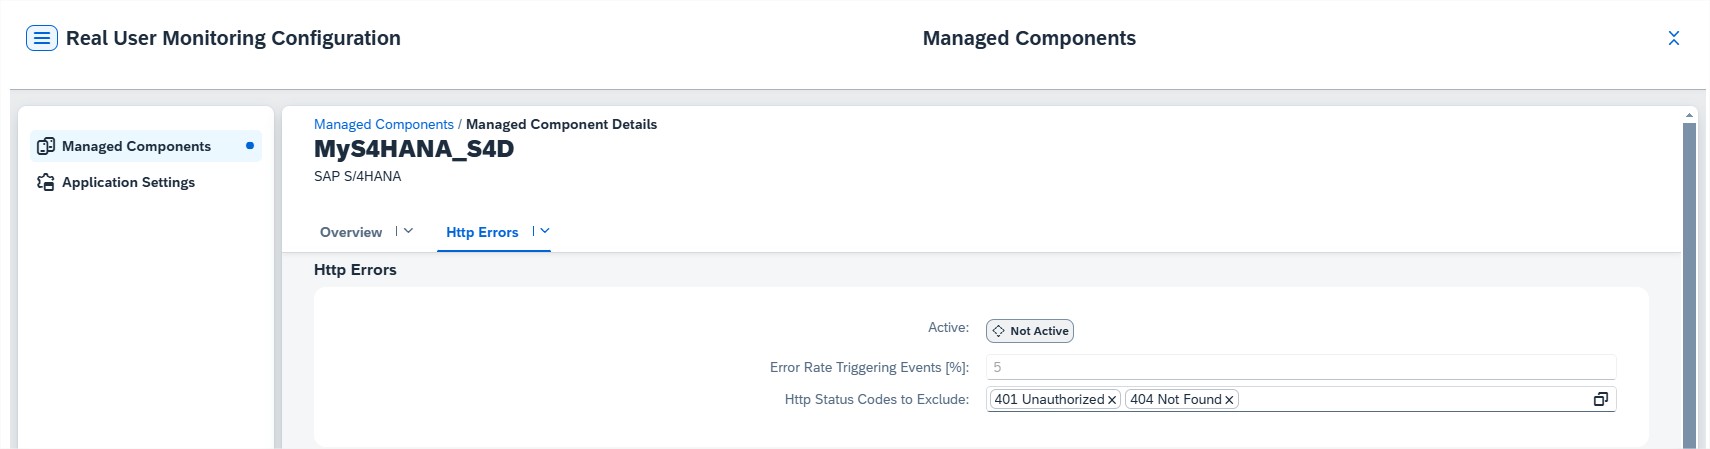
Configuration: Alerts are activated and configured in the Configuration section of the corresponding managed component.
Actions You Can Take
Sort Alerts: Sort alerts by Alert Name, Message, Status, Processor, and Object Details.
Assign/Remove Processors: Manage who is responsible for handling alerts.
Confirm Alerts: Acknowledge and confirm open alerts.
View Action Logs: Review the logs associated with each alert for a detailed history.
Export: Export the list of alerts to a spreadsheet for further analysis.
The Alerting page ensures you can stay on top of critical issues, resolve them efficiently, and maintain system reliability through proactive alert management.
Tip: How to create meaningful Favorites to Overview
For example, to display on Overview page only certain Requests, you can open a request and Save it as Favorite.
Now when going to Home page we can see the newly created favorite:
Conclusion
With Real User Monitoring organizations gain transparency into user interactions, response times, and system performance. This tool not only enhances IT teams’ ability to resolve issues efficiently but also empowers business teams with valuable insights into user behavior. As a result, Real User Monitoring helps organizations provide a seamless, optimized user experience, enhancing both operational efficiency and end-user satisfaction.
Is it the dawn of SAP Solution Manager or is it the rise of SAP Cloud ALM as this lone feathered Feature soars towards Production? It is both.
Since we are in a phase of transition, I will focus here on the question of how to use Features to bring transport requests of an OnPremise ABAP system from Development to Production.
This use case is also attractive for SAP customers who have previously given ChaRM and/or Focused Build a wide berth.
Here I focus on the so-called user experience and governance when using Features to handle OnPremise transports.
We will use our existing knowledge to contextualize these new Features. By the way, I’m talking about the state of the second half of October 2024 – this needs to be emphasized, as new functions are released every two weeks.
As we all know, SAP has a gigantic department that is constantly coming up with new names for one and the same function. Here, too, it was very successful: even at first glance, a Feature seems to be just a nice new name – who wants bugs – for the good old Change Document. There is also no longer any talk of transports in the Transport Assignment Block, but the latest buzzword is now “Deployment Orchestration of Transport Containers”.
At second glance, the Feature reminds us of the good old TMS Workflow.
Creating or referencing
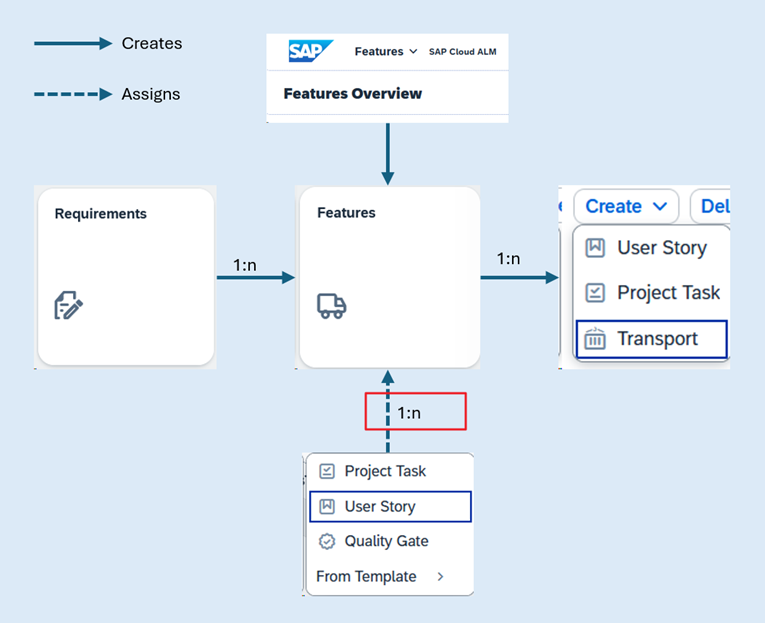
As of today, Features can only be created from the “Features Overview” or from a “Requirement”; in addition, you can reference exactly one Feature from a “User Story”, and only here.
In a Feature, you can not only create Transport Requests, but also User Stories and Project Tasks.
It was also possible to create Tasks (Transaction Type “1003”) as successor documents in ChaRM Change Documents.
I demonstrated to colleagues how this could be used to involve additional team members in a change process instead of contacting them by e-mail, which would establish a holistic concept of the Change Document, with which one could achieve very good documentation (traceability), but this was never accepted, it stayed with the informal e-mails.
I therefore fear that the option to create follow-up Tasks will also be left unused in the Feature.
Error correction during testing
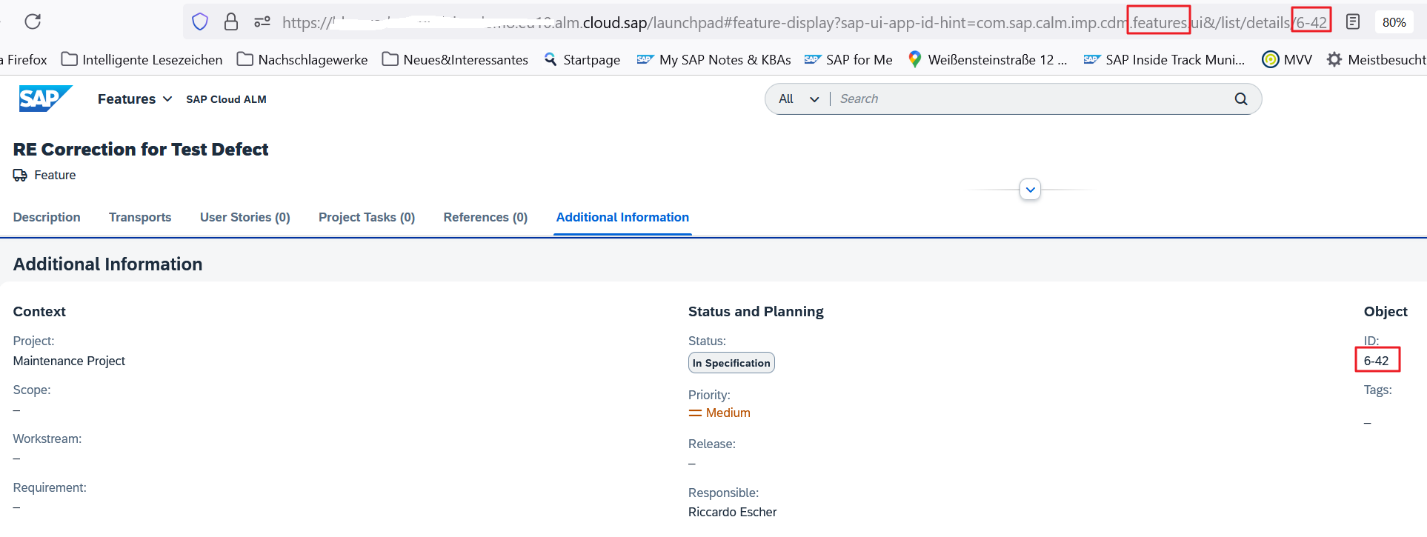
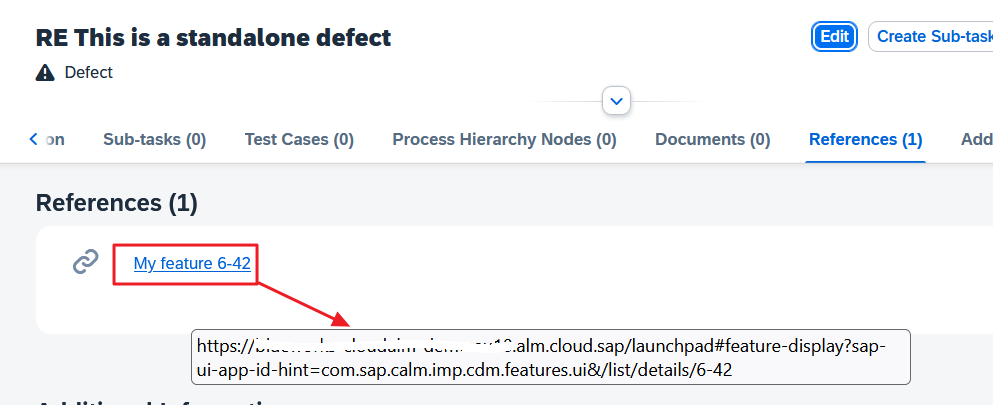
What really surprises me is that there is still no direct link between a test defect (technically a task type) and a Feature. You have to take a detour here.
First you have to create the Feature:
Only then can you add the URL of the new Feature in the Test Defect as a reference using copy&paste:
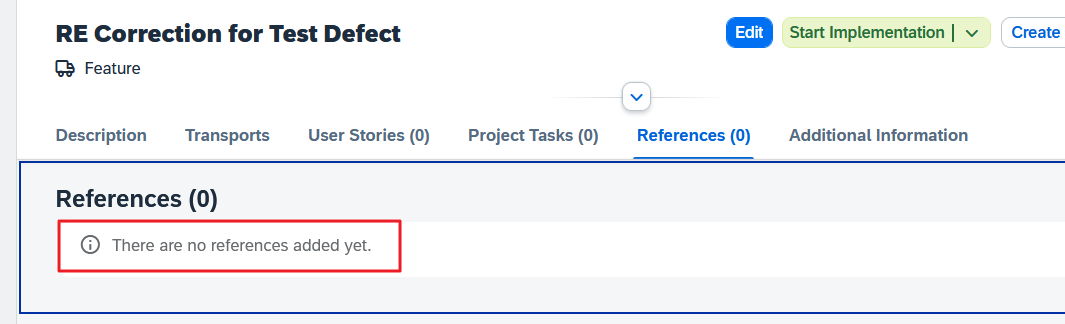
If you want to document in the Feature for which Defect you are working, you have to repeat this procedure for the other direction (URL of the Defect as a reference in the Feature), because there is no automation here yet:
I already anticipate that this cumbersome manual linking will not meet with much acceptance.
In contrast to ChaRM and more in line with Focused Build, Features are always linked to Cloud ALM Projects.
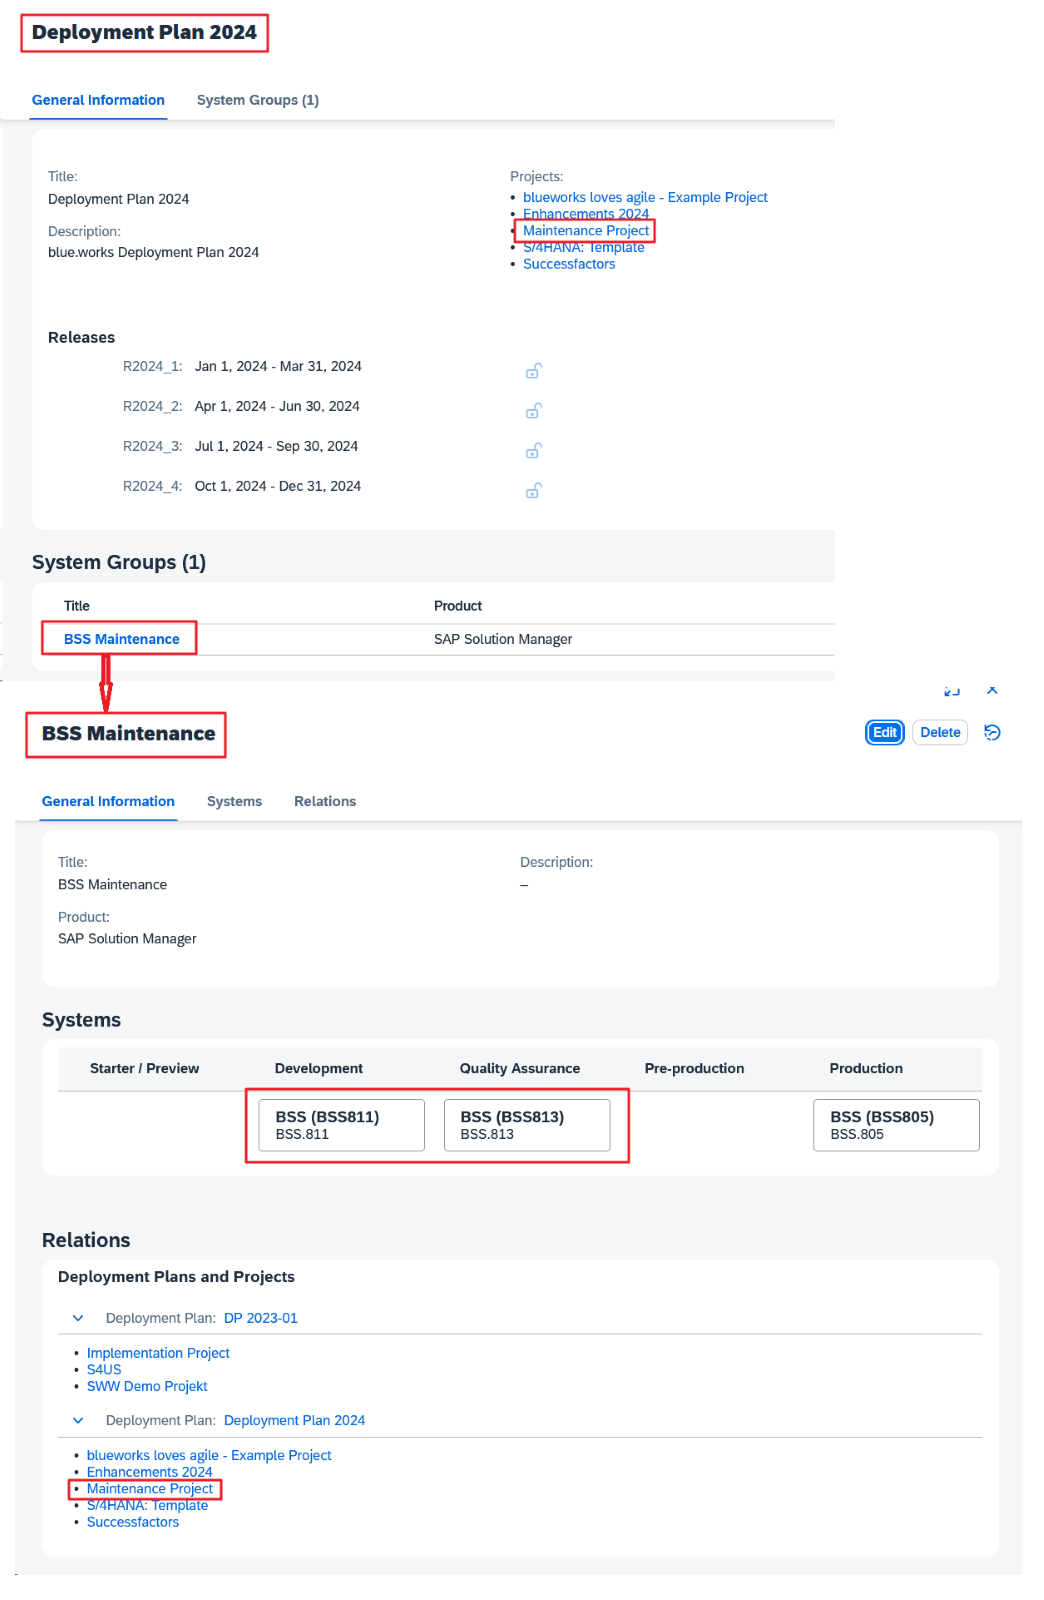
These Projects reference a “Deployment Plan”, which is similar to a ChaRM Change Control Landscape (CCL), and just like the latter, this “Landscape” contains one or more “System Groups”. Each “System Group” in turn contains a Track, which was previously called a Logical System Component. This means that, as before, several tracks can be used with one Change, oh, sorry, Feature.
In our examples, we use a Project called “Maintenance Project”, which uses the creatively named Plan “Deployment Plan 2024”, which in turn only knows one System Group, namely the equally originally named “BSS Maintenance”.
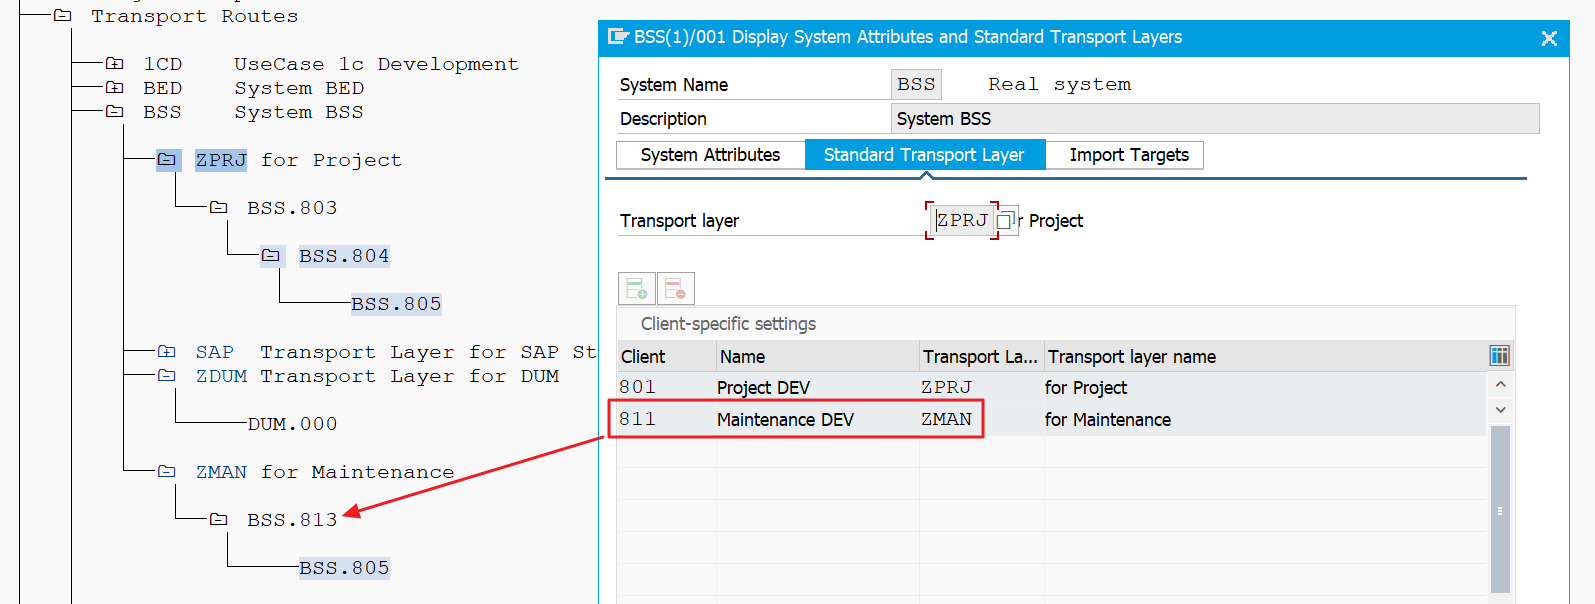
Our demo landscape on the OnPremise ABAP system has two tracks, a four-system track for projects (BSS.801 🡺 803 🡺 804 🡺 805) and a three-system track for maintenance (BSS.811 🡺 813 🡺 805).
The maintenance Project is also defined accordingly in Cloud ALM:
The counterpart would be “BSS Project”, but is not used in our examples.
We try out the creation of a transport request
Our screenplay: We don’t want to draw anyone’s attention to our developments in order to avoid discussions, so we leave our Feature in the “In Specification” status and create transports straight away, because it is already possible in this initial status! To create transports, we need the powerful “Project Lead” role, which of course that is why it was granted to us.
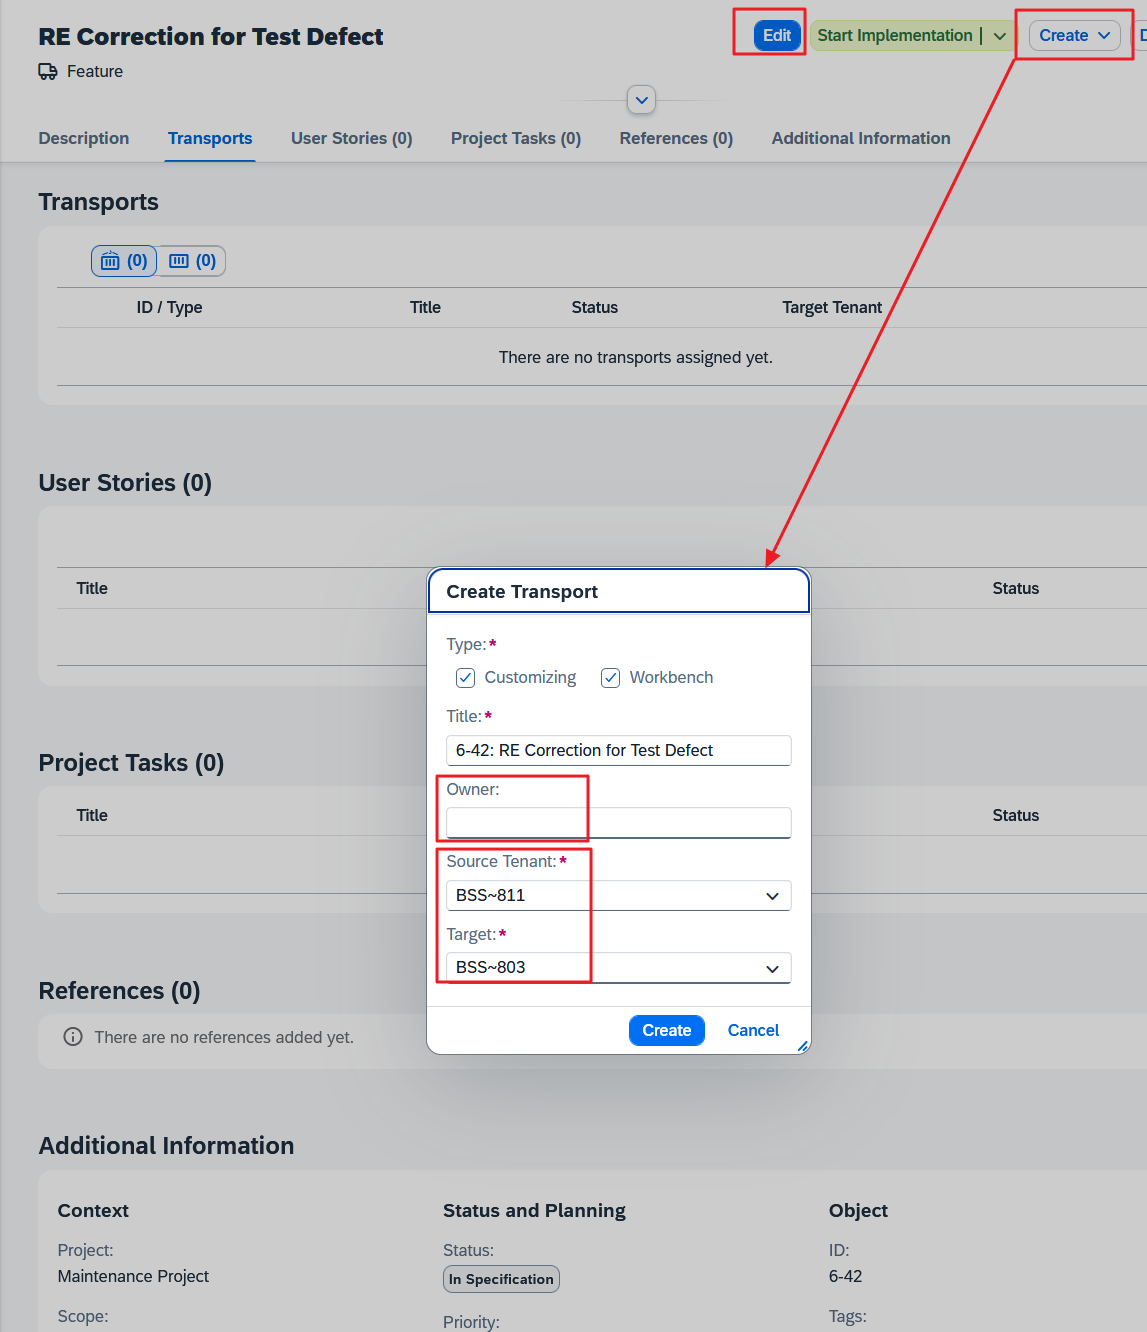
It is strange that – in contrast to ChaRM – you can only create transports if the Feature is not in change mode (see the active Edit button), and this Create button is in the Feature header, as if a transport were an entity on the same level as User Stories etc.
However, if you want to add an existing transport to the Feature, you must switch to Edit mode instead and then navigate to the “Transports” section.
You get used to it.
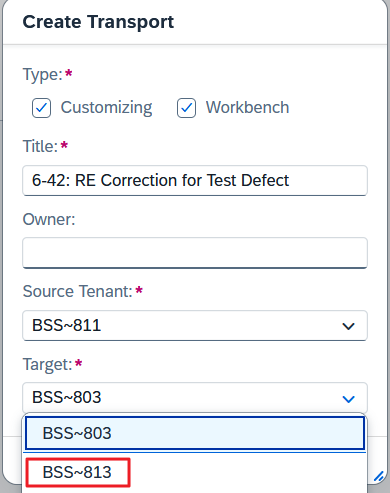
BSS~813 would actually be the right choice for the “Target” of the “Maintenace Project”, but its “Deployment Plan” is ignored and the extraneous consolidation system BSS.803 is offered first.
All right. I’ll pretend I’m as scatterbrained as I actually am when I’m in a hurry.
I overlook the fact that the wrong consolidation system is offered for the maintenance development system BSS.811 and wave the transport creation through.
I also overlooked the fact that there is an “Owner” field and left it empty. This input field was missing a value help for the possible User IDs from the development system anyway.
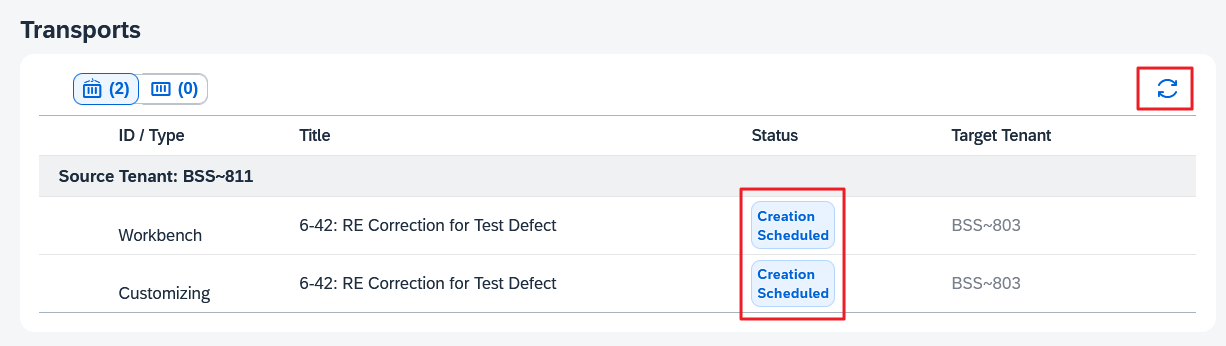
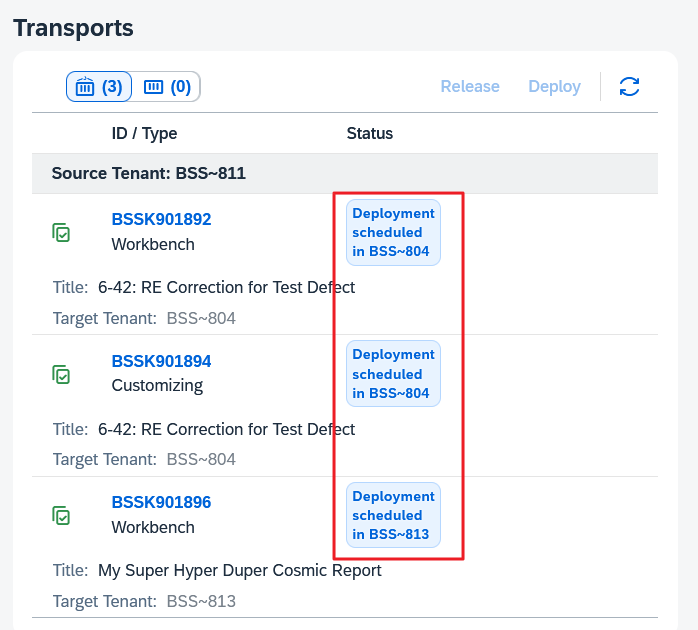
As only a flag for a transport creation is created in Cloud ALM, we now have to wait until the batch jobs finally start on the BSS.811 system and fetch the task from Cloud ALM, execute it and return the result. This means patiently pressing the refresh button repeatedly:
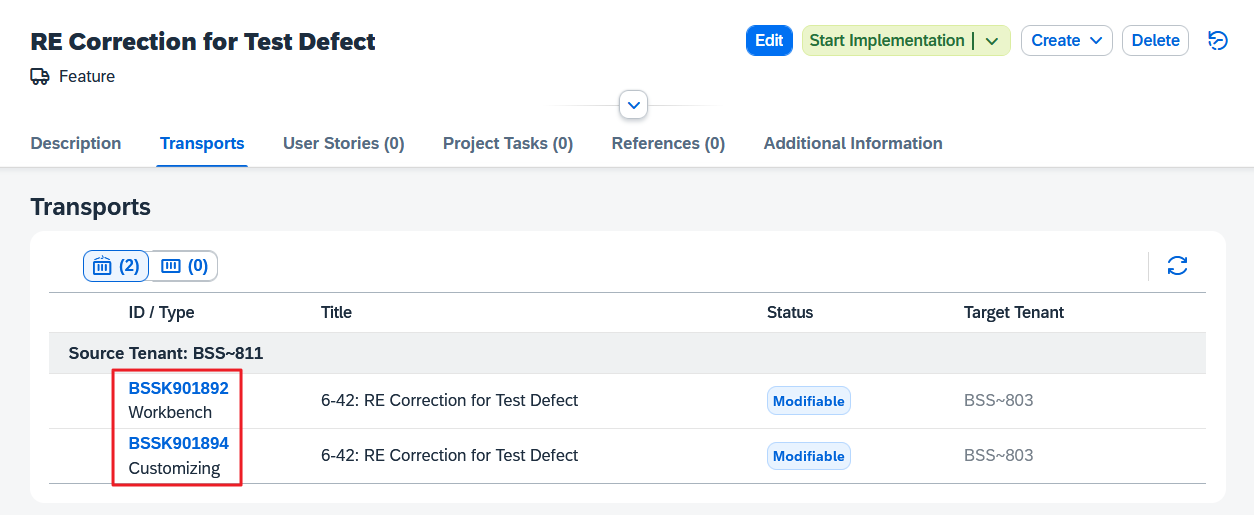
Soon we will have made it:
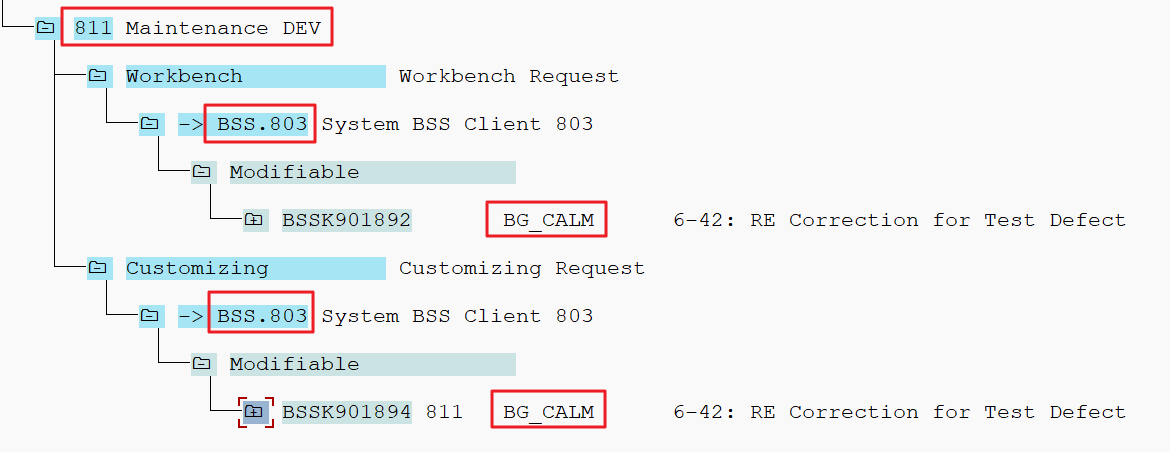
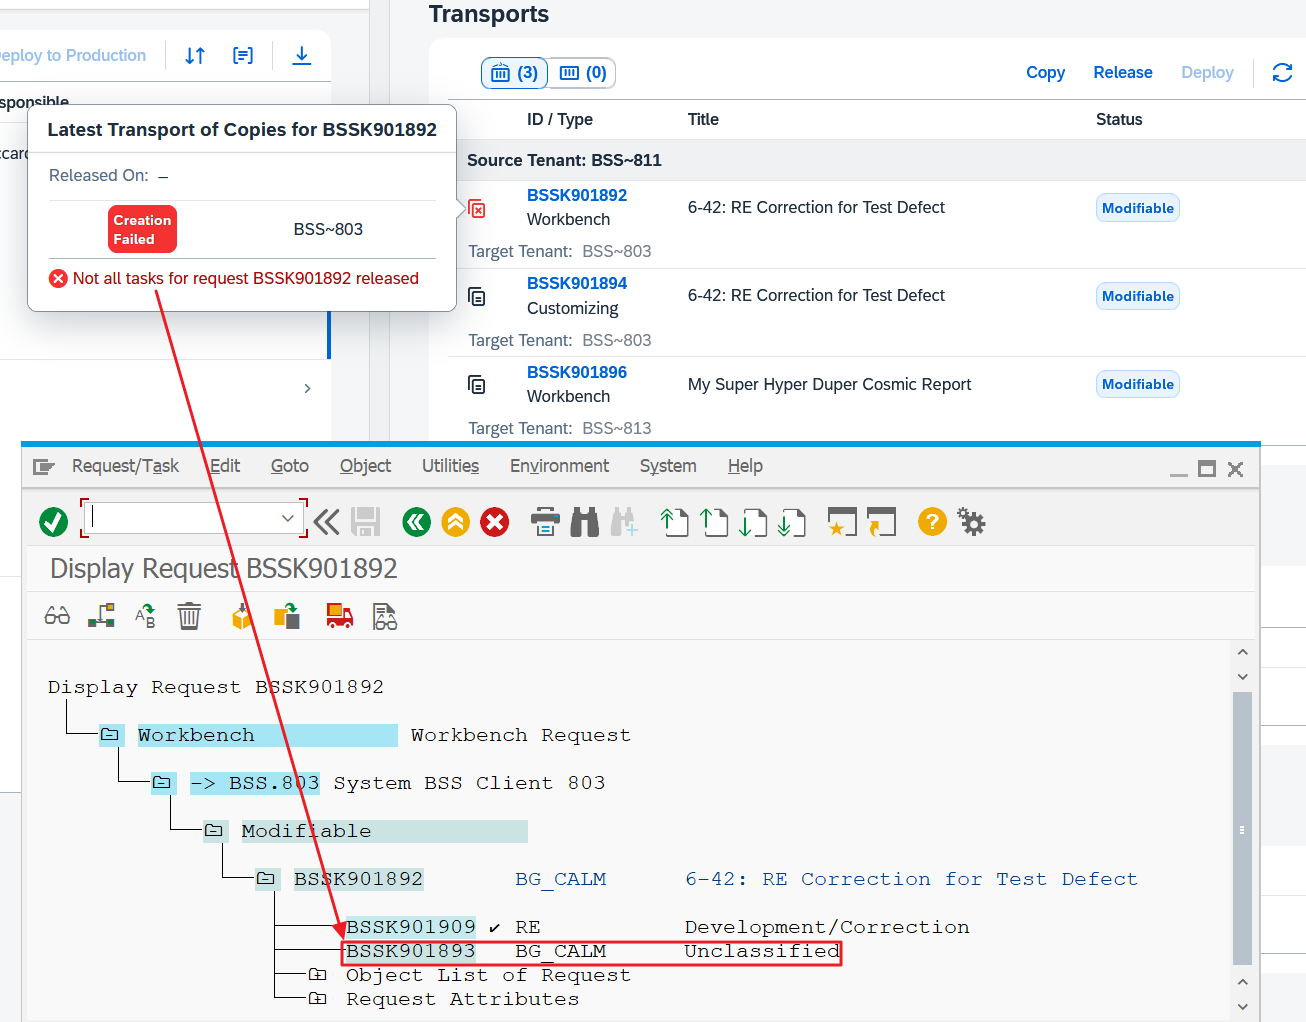
We log into the maintenance development system and initially do not find the transports in transaction SE09, because we have left the optional field “Owner” empty and thus the owner of the batch job has been used, in our case “BG_CALM”:
Not a big problem if we have the authorization in the development system to change the owner of a transport.
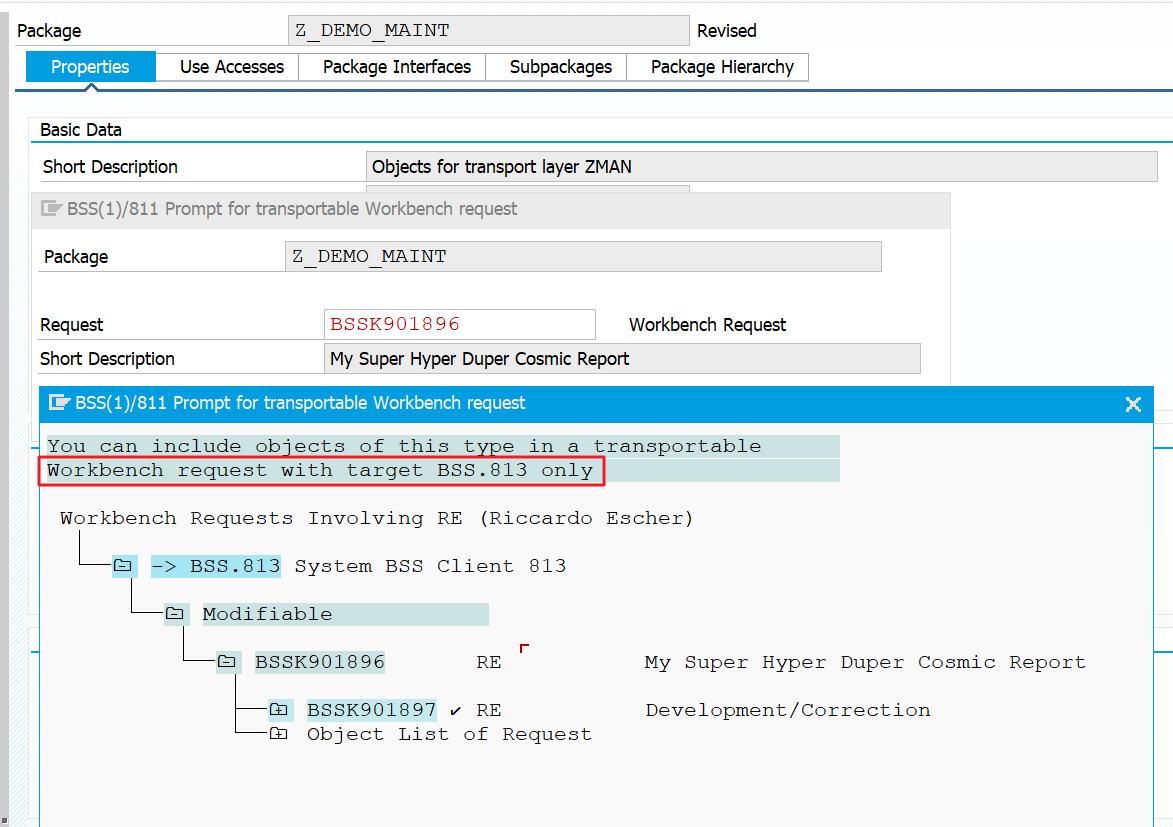
But if we want to work with the transports we have just created, we immediately encounter problems:
The transport BSSK901892 actually intended for development is not offered for selection, as it unfortunately has the wrong destination.
Despite existing pitfalls to be aware of, creating a transport from a Feature has the advantage that both the descriptive and the technical Feature ID are documented:
It is better to add transports
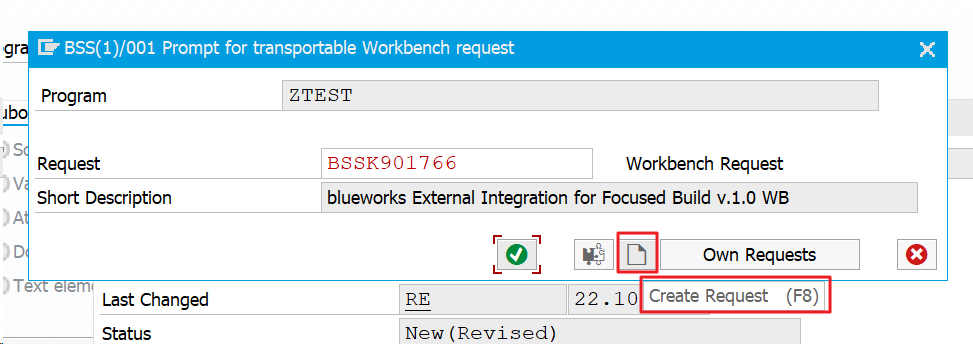
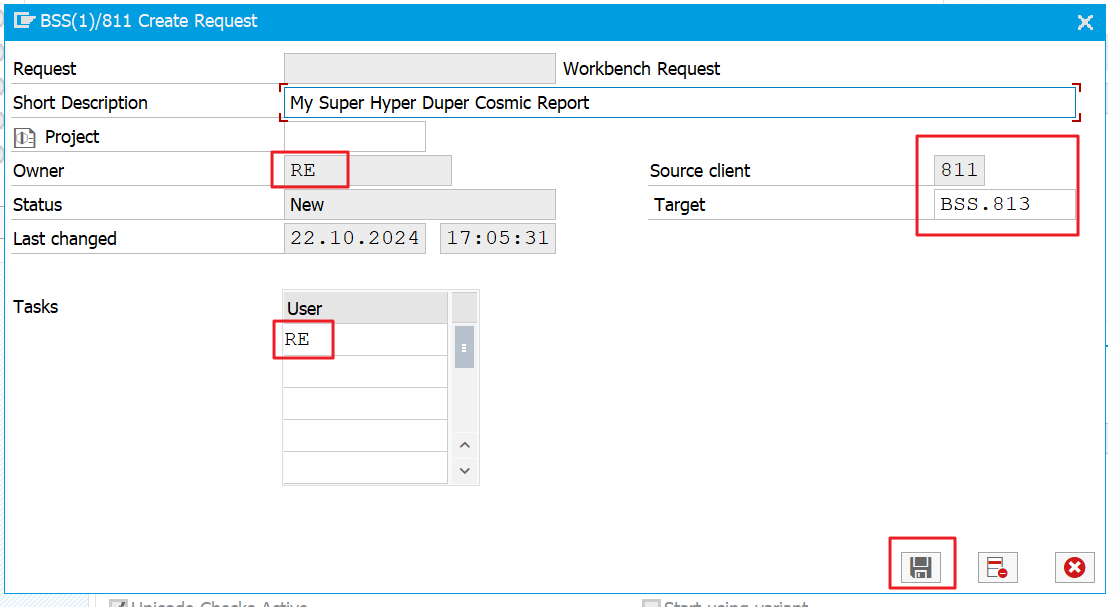
Because of this error-proneness, it is better in my opinion to create a new transport from the respective application during development and/or customizing – as in R/3 times:
You also do not need the same extensive authorizations as for creating transports (see above).
The advantage is that the Change and Transport System (CTS) automatically sets all values (Owner, Target) correctly:
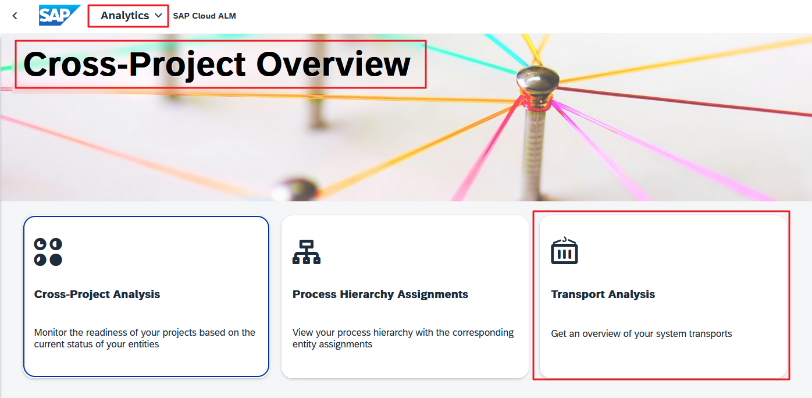
The high-frequency synchronization job sends this transport data to Cloud ALM so that it will soon be visible. This can be checked with the “Transport Analysis” app, for example:
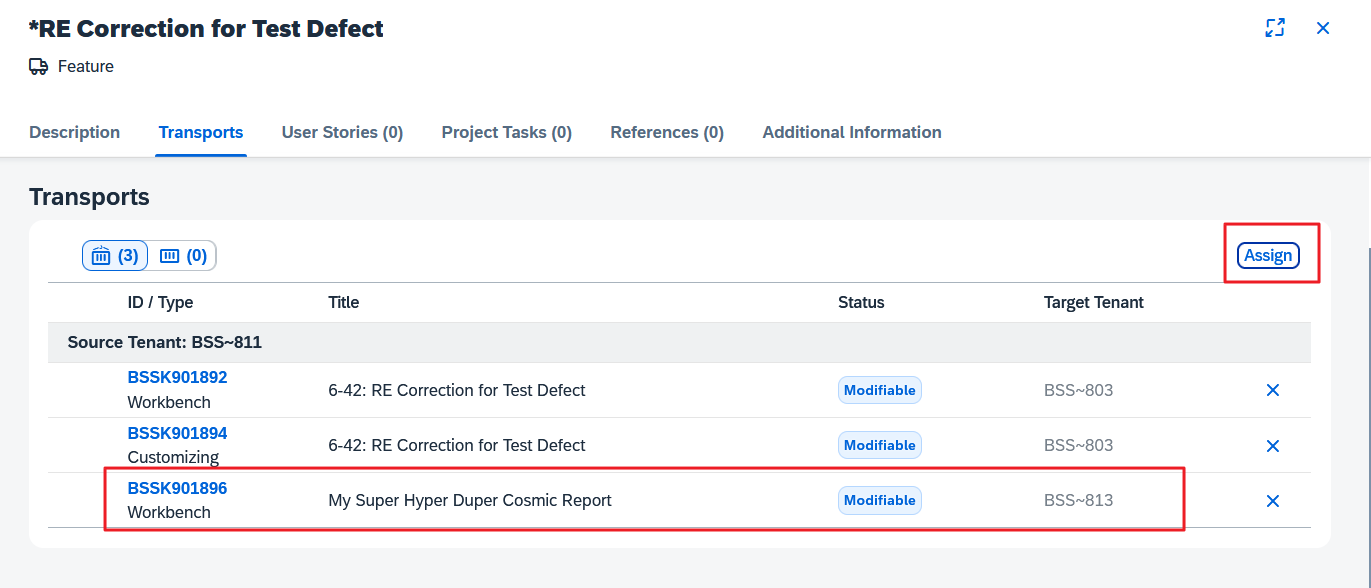
If the new transport is known in Cloud ALM, we can set the Feature to change mode and “Assign” the new transport:
Fortunately, the Assign dialog only offers transports that have the Source Tenant BSS~811.
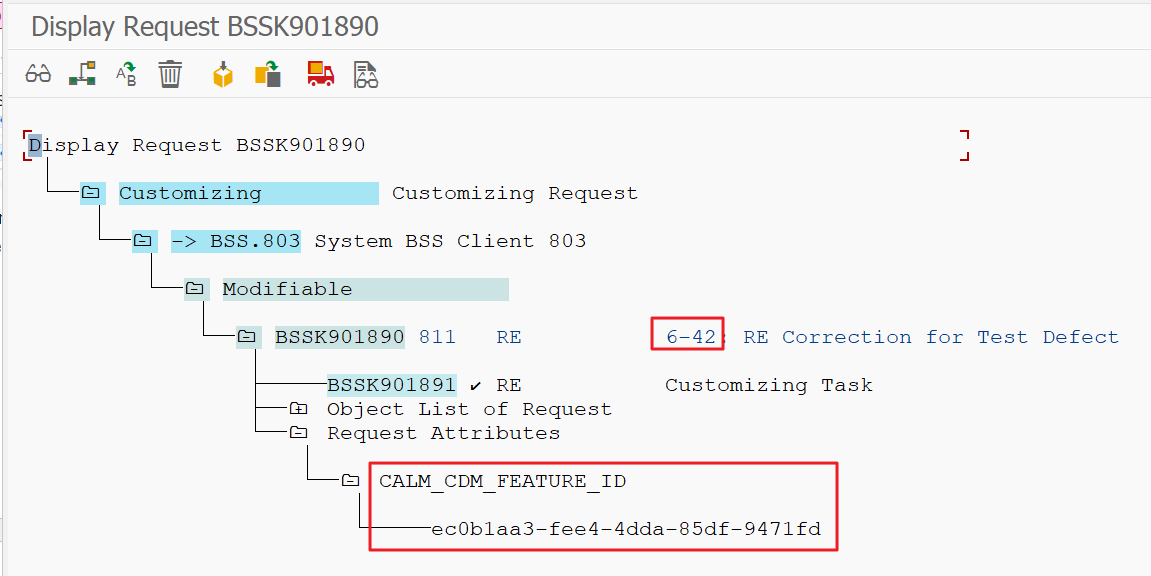
The only disadvantage of this procedure is that the technical Feature ID is not documented as an attribute of the transport. But this has no consequences.
Difficult coexistence
Since the early days of ChaRM, we have had to turn on the CTS Project constraint when setting it up correctly so that the project switches for transport actions force only the ChaRM (or Focused Build) to be able to create, release and import transports.
However, Cloud ALM has been simplified here and therefore no longer knows any CTS projects. So you should use transaction SE03 🡺 “Display/Change Request Attributes” to remove again this obligation to enter the SAP_CTS_PROJECTS.
There is no “Selective Data Transfer” to Cloud ALM for ChaRM and Focused Build. You have to work through and finally complete their cycles and only create anything new by Feature in the meantime.
If you wanted to maintain the strict governance in ChaRM in this phase of coexistence, you would have to revoke the authorization to release transports (authorization object S_TRANSPRT, Activity 43) from all users in the development system in order to gently force the switch to cloud ALM Features, but who can do that on an established development system?
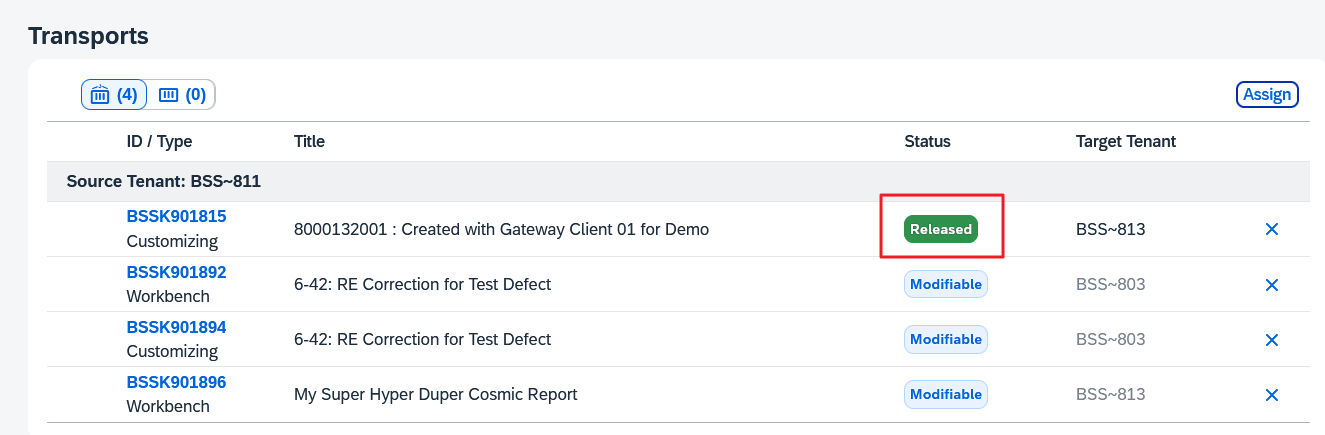
Ignoring the CTS Projects has one advantage: You can also add transports that have already been released to a Feature:
Testing with Transport of Copies (ToC)
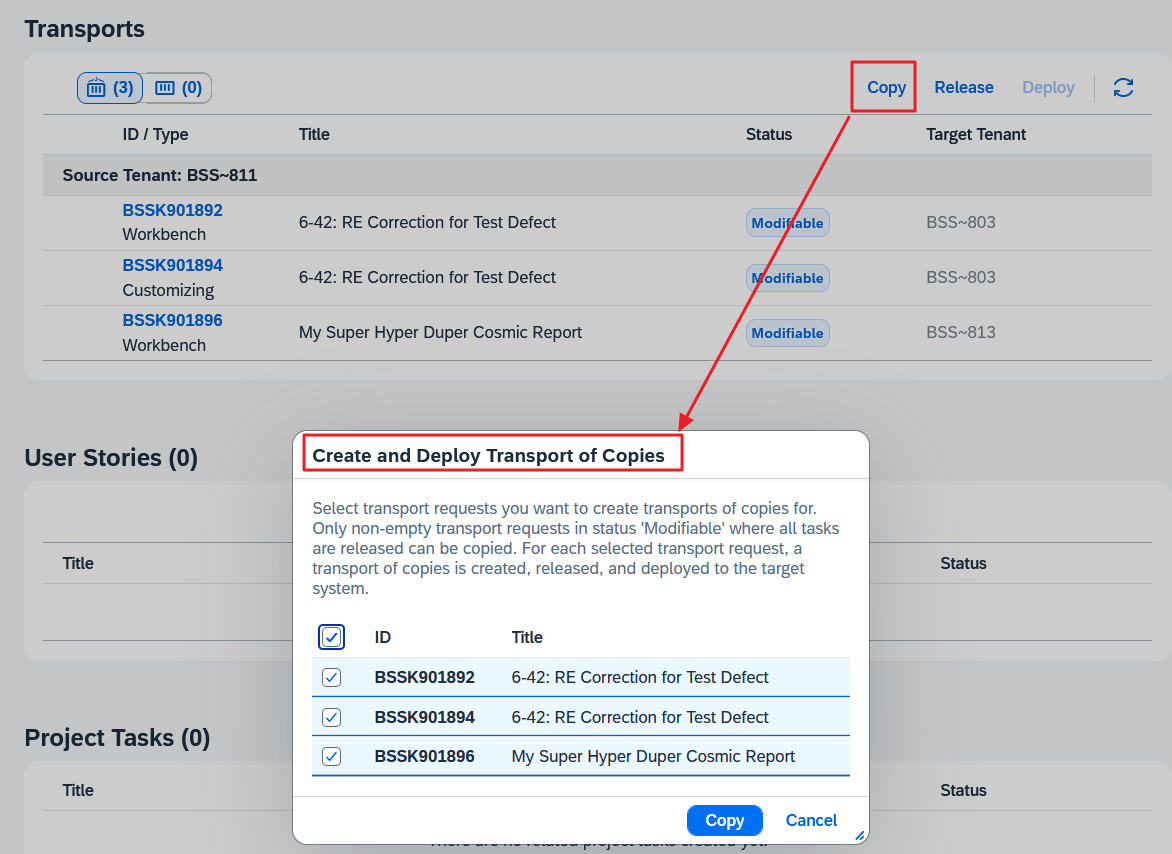
Unlike the Normal Change of ChaRM (and Focused Build), testing in the consolidation system with ToCs is voluntary. You must explicitly press the button and select the sources for the ToCs:
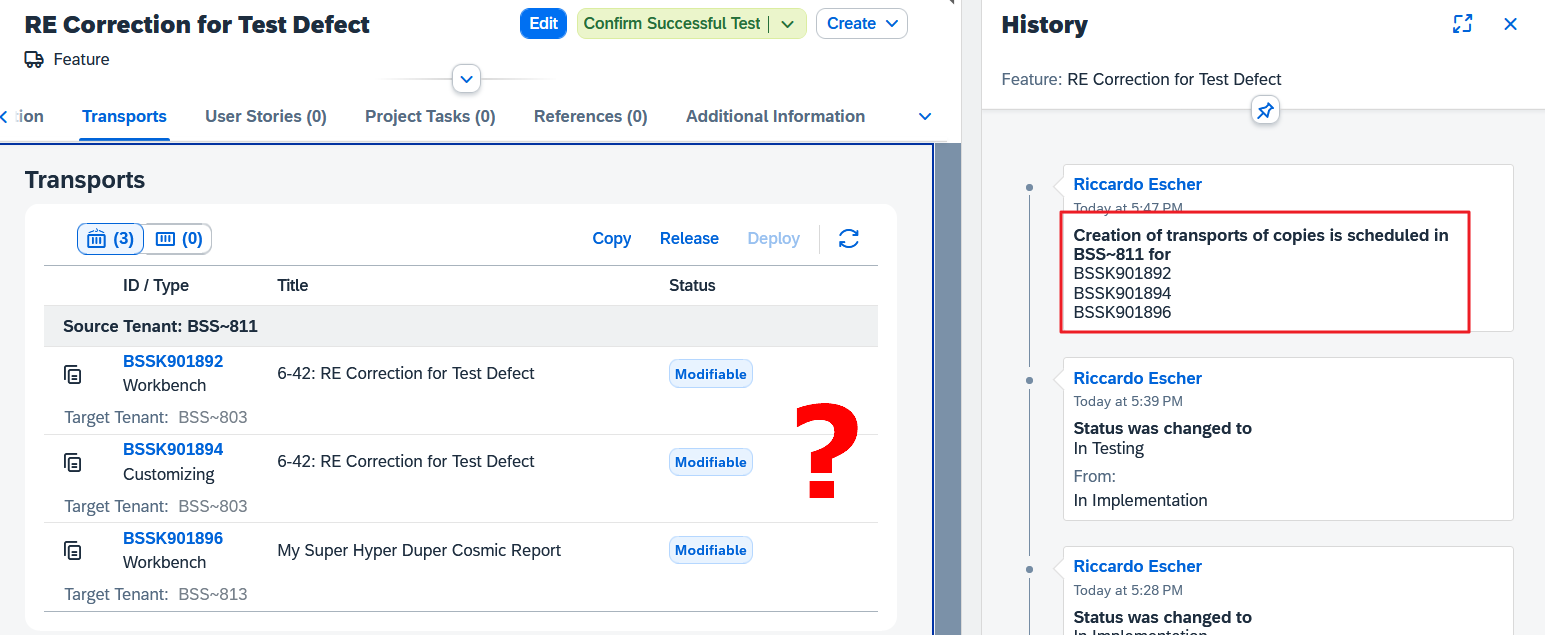
Unfortunately, there is no visible feedback that you have requested the creation of ToCs; you can only see this when you open the history:
The ToCs only become visible once the batch job has completed its work in the ABAP system.
We note that the friendly deletion of empty transport tasks as in ChaRM is now missing again:
Status dependency of transport activities
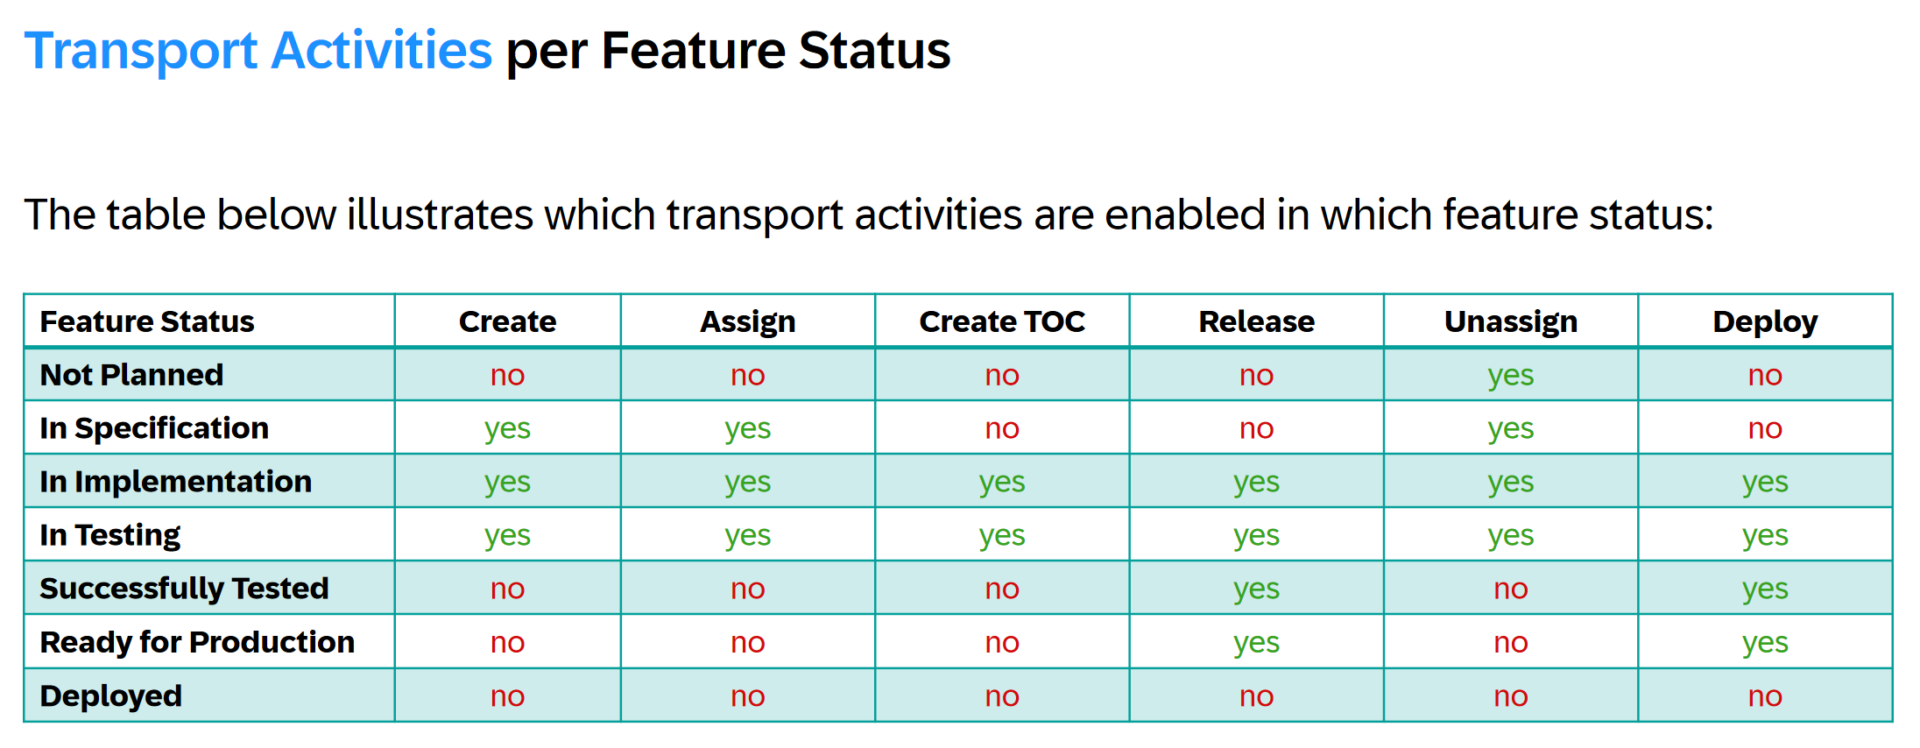
Depending on the status of the Feature, the following transport-related activities can be carried out in a Feature:
As you can see, everything is permitted not only in the “In Implementation” status, but also in the “In Testing” status. This is completely different from a ChaRM Change Document, where there is a strict separation between development and testing. The reason for this high degree of freedom is not clear to me.
Let’s assume that the tester has successfully tested the function in the ABAP QA system and then goes into the lunch break on the high of the success he has experienced. He wants to set the new status “Successfully Tested” after the break together with a cup of coffee.
In the meantime, the developer remembers that she had forgotten something; she quickly creates a transport, records the change and pushes the change into the QA system.
How is it ensured that the tester tests this subsequent change before setting the status?
I also wonder in which use case a tester confirms the successful test, although the transports can still be changed:
Ah, questions over questions….
Production
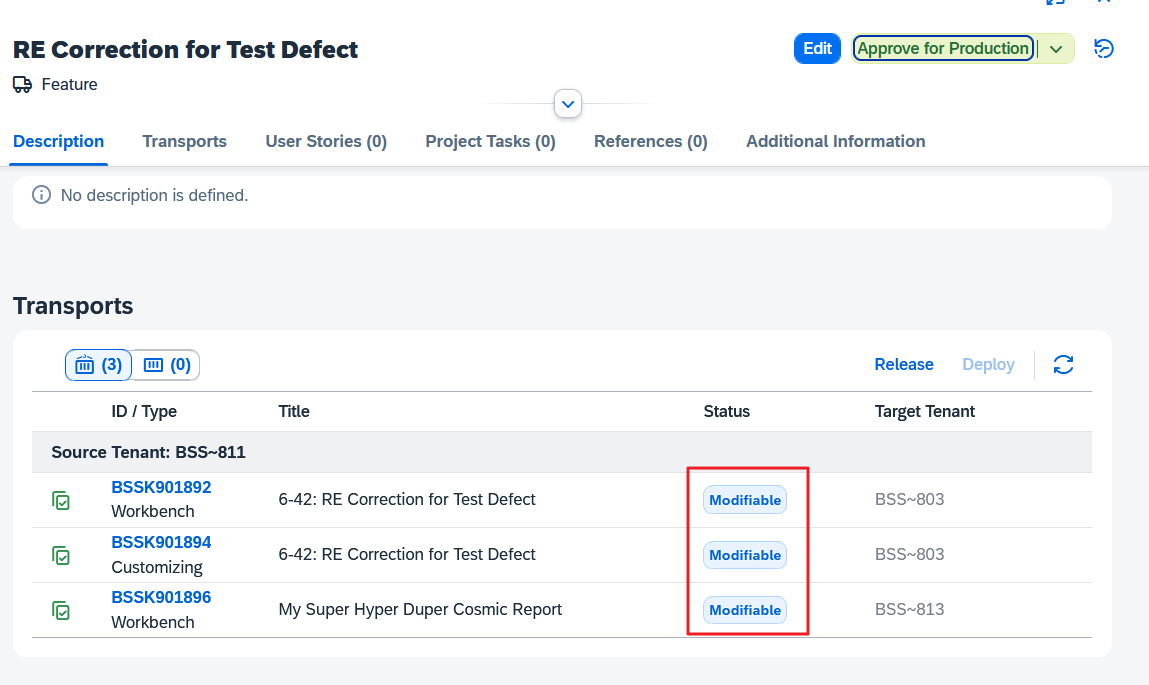
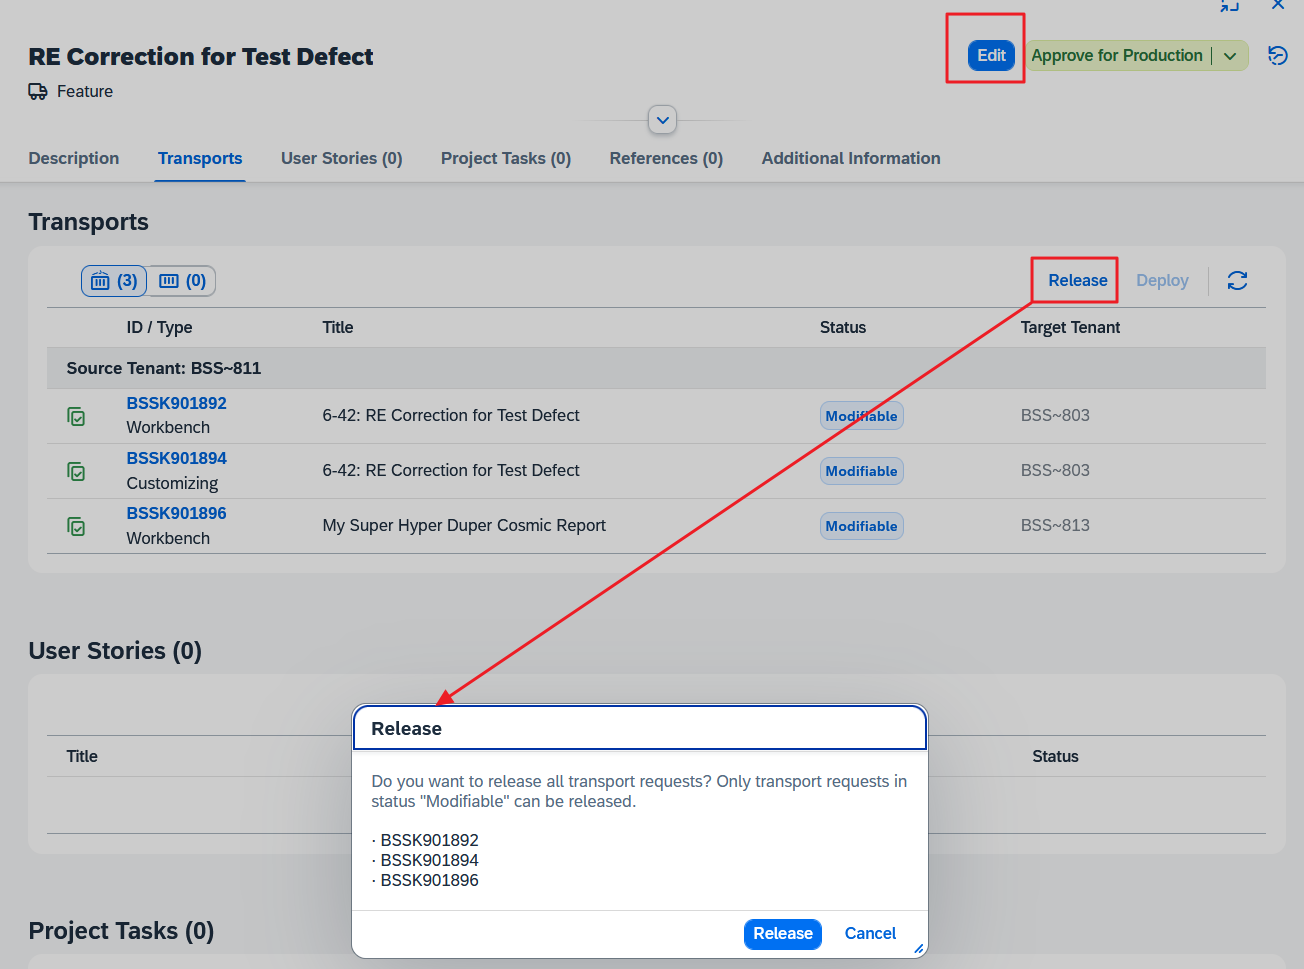
Here too, the Feature only allows transports to be released when it is not in change mode:
In contrast to the creation of ToCs, this action is immediately visible in the Feature.
The import into the subsequent systems is now called “Deployment”. Cloud ALM behaves very differently to ChaRM.
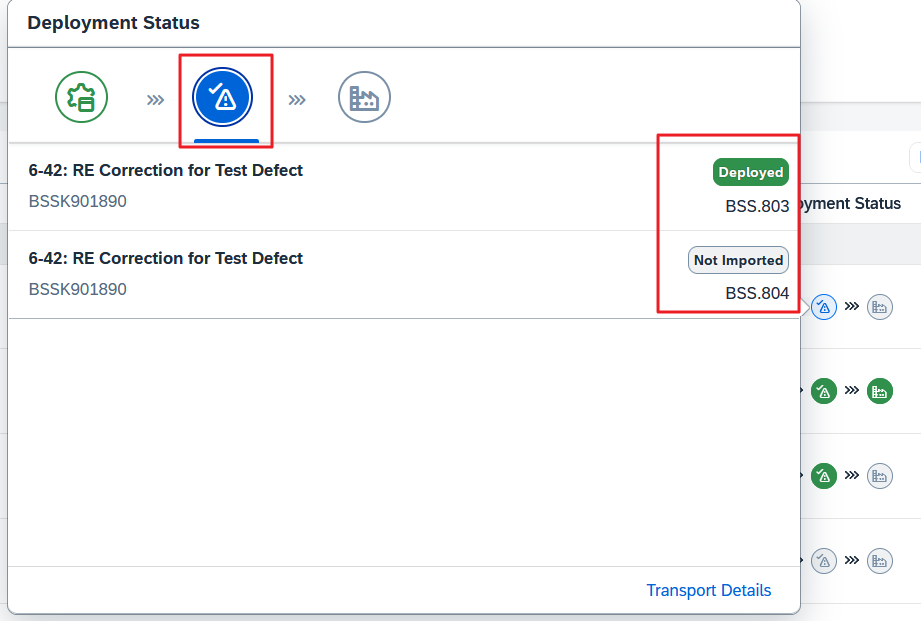
If you have a mixture of three- and four-system landscapes, as in the example, you have to get used to the fact that Cloud ALM calculates backwards from the Production system, which means that you can only import the transport of the three-system landscape into the Consolidation system (here BSS.813) when the transports in the four-system landscape have reached the Pre-Production system (here BSS.804), because both systems (BSS.804 and BSS.813) deliver to Production:
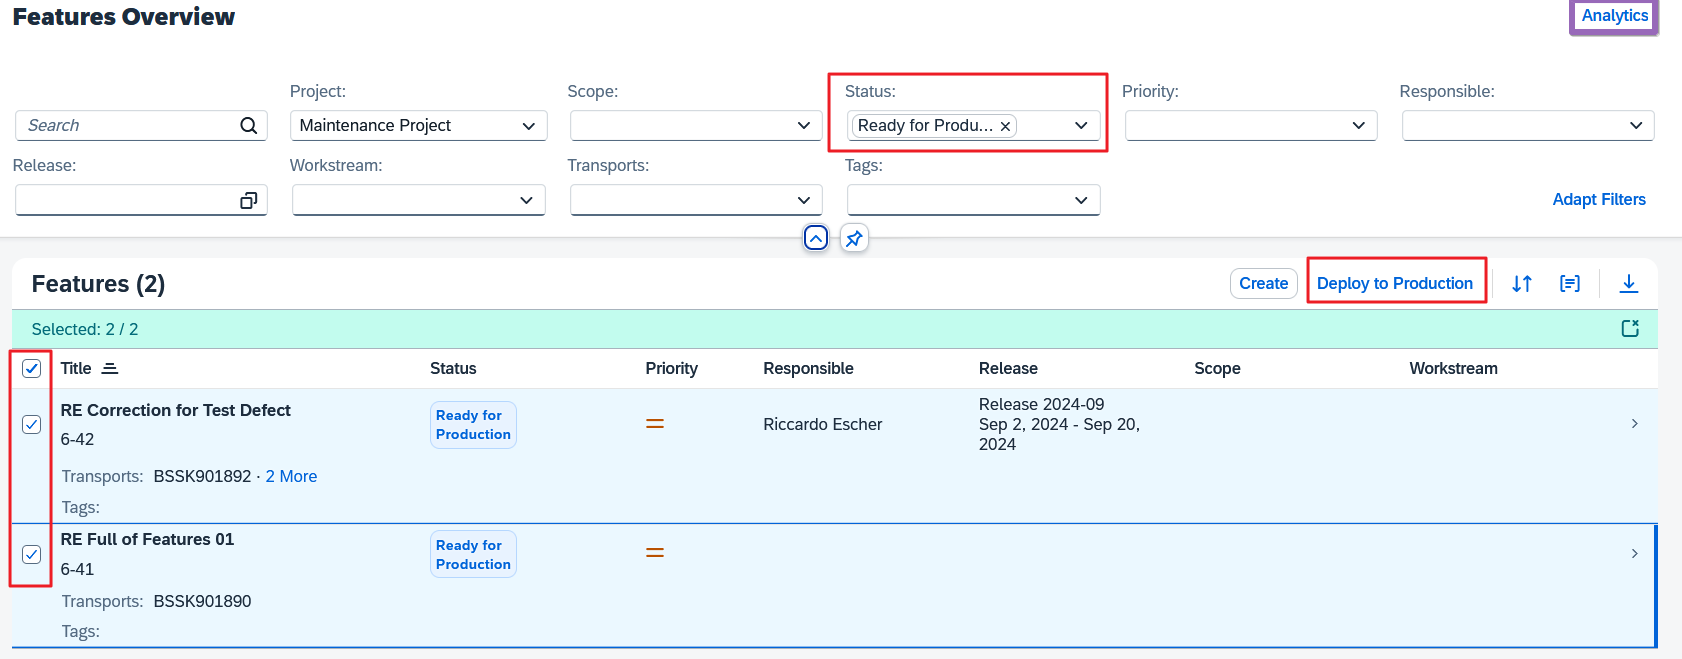
I think the final mass import from the Overview page is very nicely realized if you filter for the appropriate status:
This has the advantage that all transports selected here are imported into the production system at the same time with a tp IMPORT SUBSET.
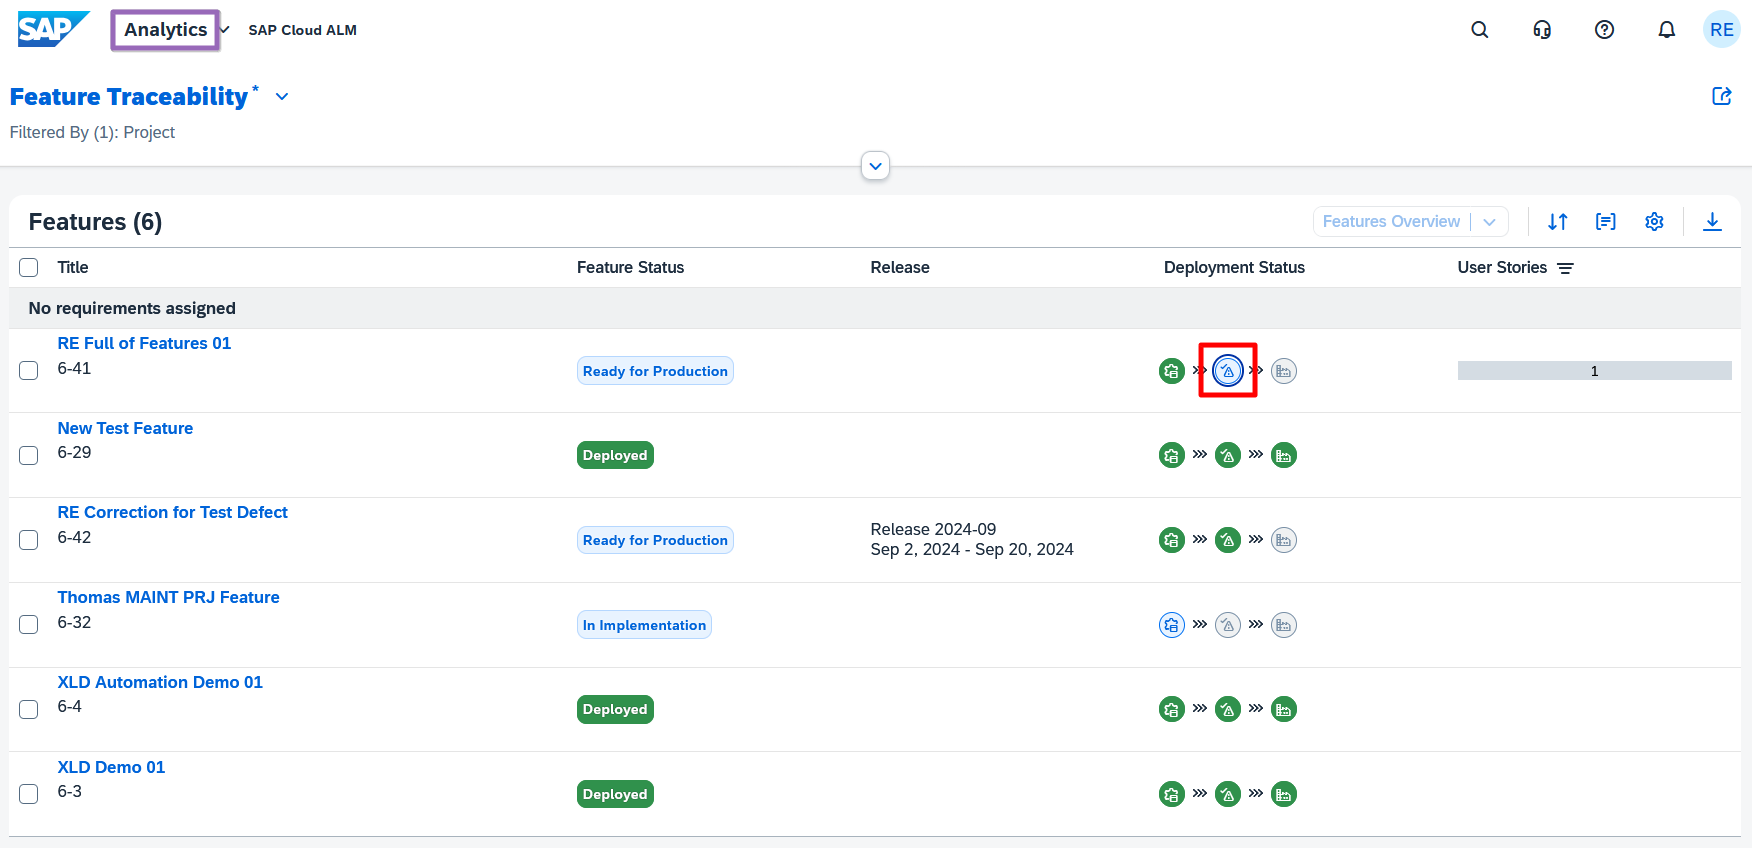
I also find the analytical “Feature Traceability” very appealing:
The only fly in the ointment is the combination of the QA and PreProd systems in one icon:
Technical handling of CTS transports
As of today, creating and/or releasing and importing an OnPremise transport request from the Feature is asynchronous.
Only a type of flag is created in Cloud ALM. A high-frequency job runs in the connected ABAP system, which retrieves the tasks from the cloud system, executes them and uploads the result to the cloud.
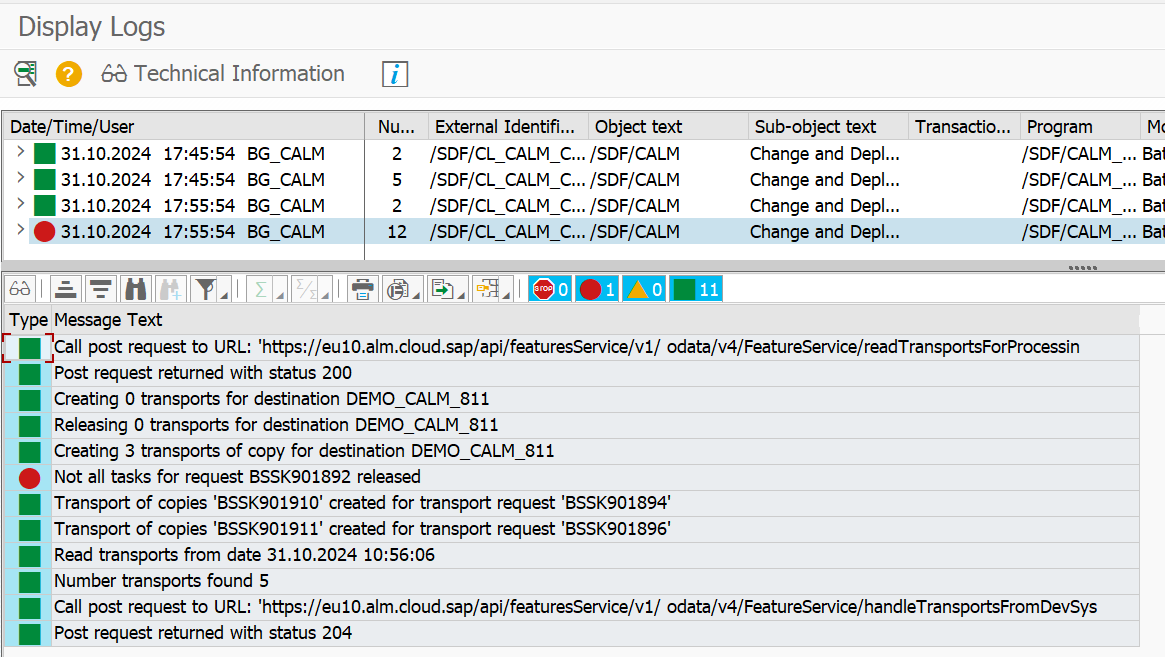
If, for example, you want to trace this process in the event of an error, you must log in to the appropriate client (for export in the development client, for import in client 000) and use transaction SLG1 with a filter for the batch process user to restrict the time period in question.
Here we are tracing the creation of the ToCs from before:
You cannot access these logs from within the Feature.
In conversations during the ALM Summit 2024 in Mannheim, I learned that a direct connection between the Features and the OnPremise ABAP system will be offered in future via the SAP Cloud Connector.
Summary
ChaRM and Focused Build have matured over twenty years to become the lighthouse application of the Solution Manager and of course Cloud ALM needs time to be able to compete with this giant:
The SAP team is working flat out to shoot up to ChaRM/FB, here I offer a short summary with an outlook:
Features can be used to create CTS transports and move them through the landscape; if you have a simple system landscape, you can already easily control ABAP transports with Features today
Cloud ALM is very easy to set up and the Features are seamlessly integrated into the Cloud ALM Implementation scenario
The look and feel of the UI is outstanding, the performance is amazingly good
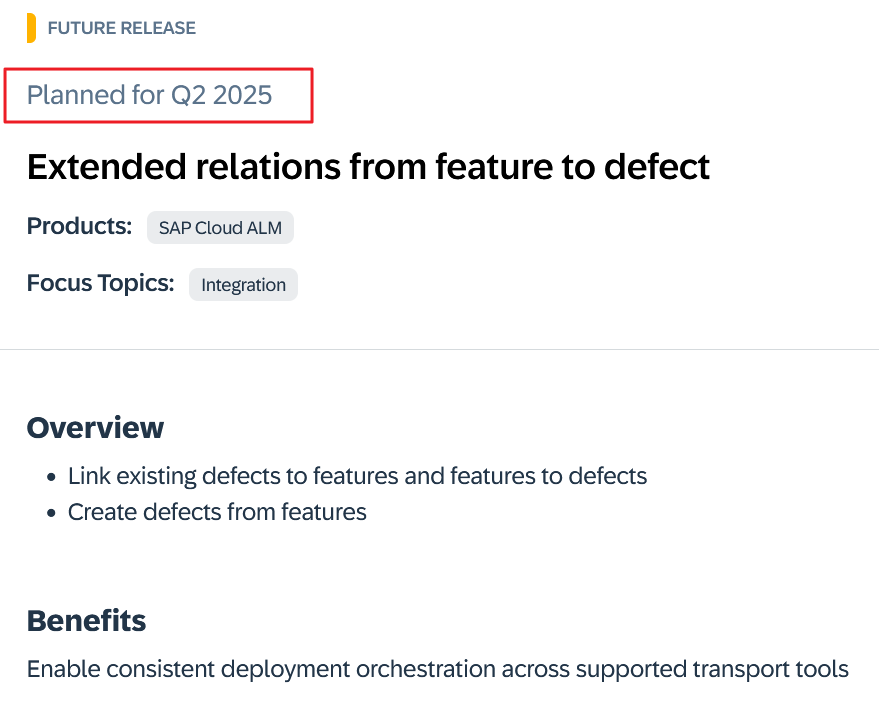
The scenario “Customizing/code correction due to incorrect test result” is not directly supported as of today, according to the roadmap it will not come until Q2 2025, but there is a somewhat cumbersome detour
Cloud ALM does not know CTS Projects, so coexistence with ChaRM/Focused Build in a transport landscape is not recommended
The creation of transports from the Feature allows too much freedom; it is better to create the required transports directly in the ABAP system and then assign them to the Feature.
The great freedom in status dependency and in defining the target systems is very reminiscent of the old TMS workflow
However, if you need a strict set of transport rules, you should wait; time is cyclical: just as ChaRM and then Focused Build emerged from the shortcomings of the TMW workflow twenty years ago, this cycle is now repeating itself – albeit with a much faster rotation – because SAP is already planning the leap to Focused Build-like checks; however, the planning is only partially fixed in the Roadmap:
An addition to ITSM
Cloud ALM is explicitly not intended to be an ITSM tool.
If, as I mentioned at the beginning, you have never used ChaRM or Focused Build before, but now finally want to introduce an audit-proof Change Management system that covers the entire process from the incident to the productive transport, then you might want to follow the path taken by the City Administration of Bern (CH).
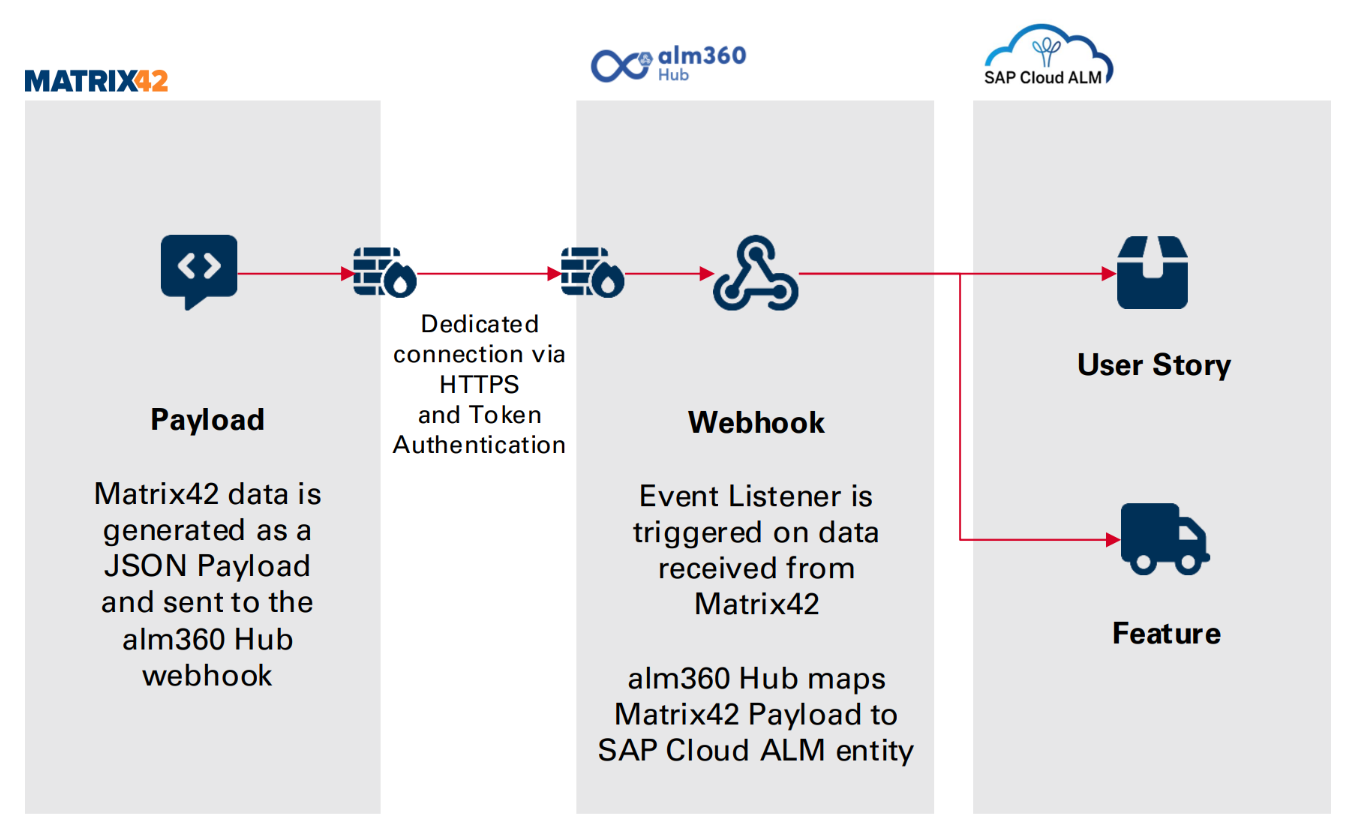
With the help of our alm360 Hub, an external ITSM tool was linked to Cloud ALM, thus ensuring traceability throughout the entire process:
Welcome to our bi-weekly SAP Cloud ALM – What’s New series! Every two weeks, we bring you the latest enhancements and features in SAP Cloud ALM, designed to elevate user experience with improved performance, new functionalities, and refined user interfaces. In this edition, we’re excited to explore the updates rolled out for SAP Business Transformation Center and Implementation areas in week 46, other areas didn’t get any updates this time. Let’s dive into what’s new!
SAP Business Transformation Center
Transformation – Modeling allows now to edit the name and the category of custom transformation objects using the Edit button that is available in the Custom Transformation Objects app.
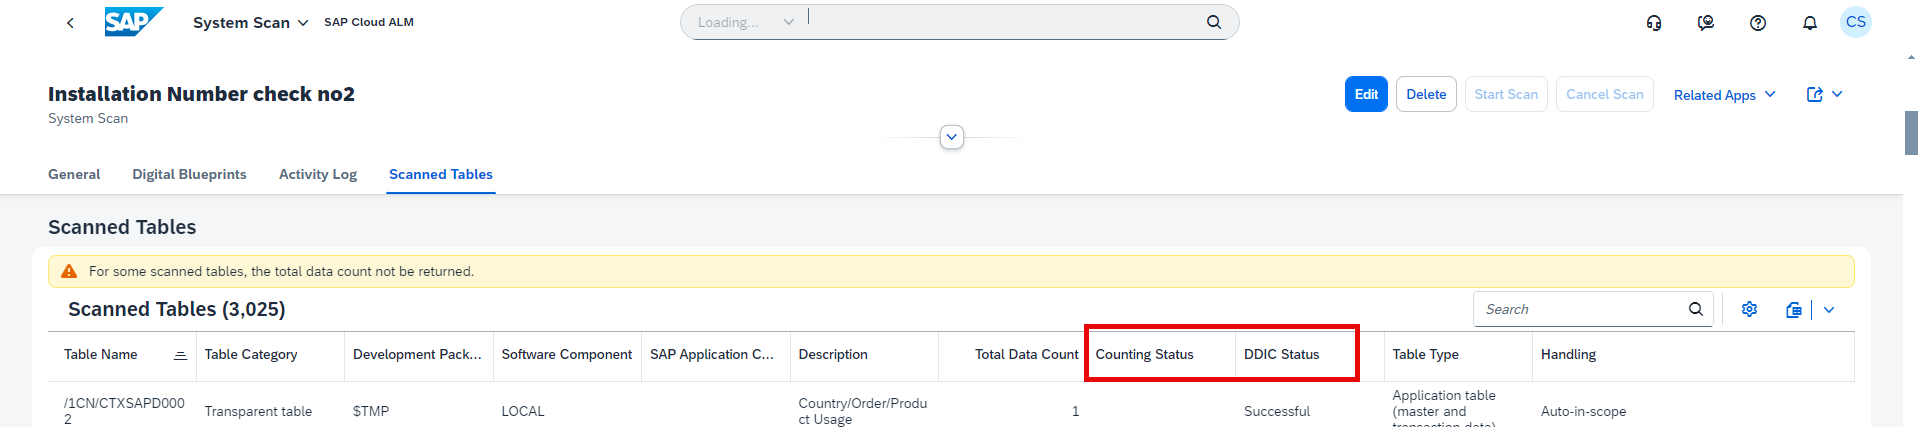
Scoping has new counting status and DDIC status columns for scanned tables. In Manage System Scans app, when in the Scanned Tables tab of the detail view of an individual system scan, now it’s possible to see the counting status for each scanned table in its own column.
Additionally, the DDIC Scan Status has been renamed to DDIC Status, and it displays the status of the DDIC scan for each scanned table. This gives a more granular view of the status of each system scan, allowing to check the tables in ABAP system for which the DDIC scan or counting has failed.
Implementation
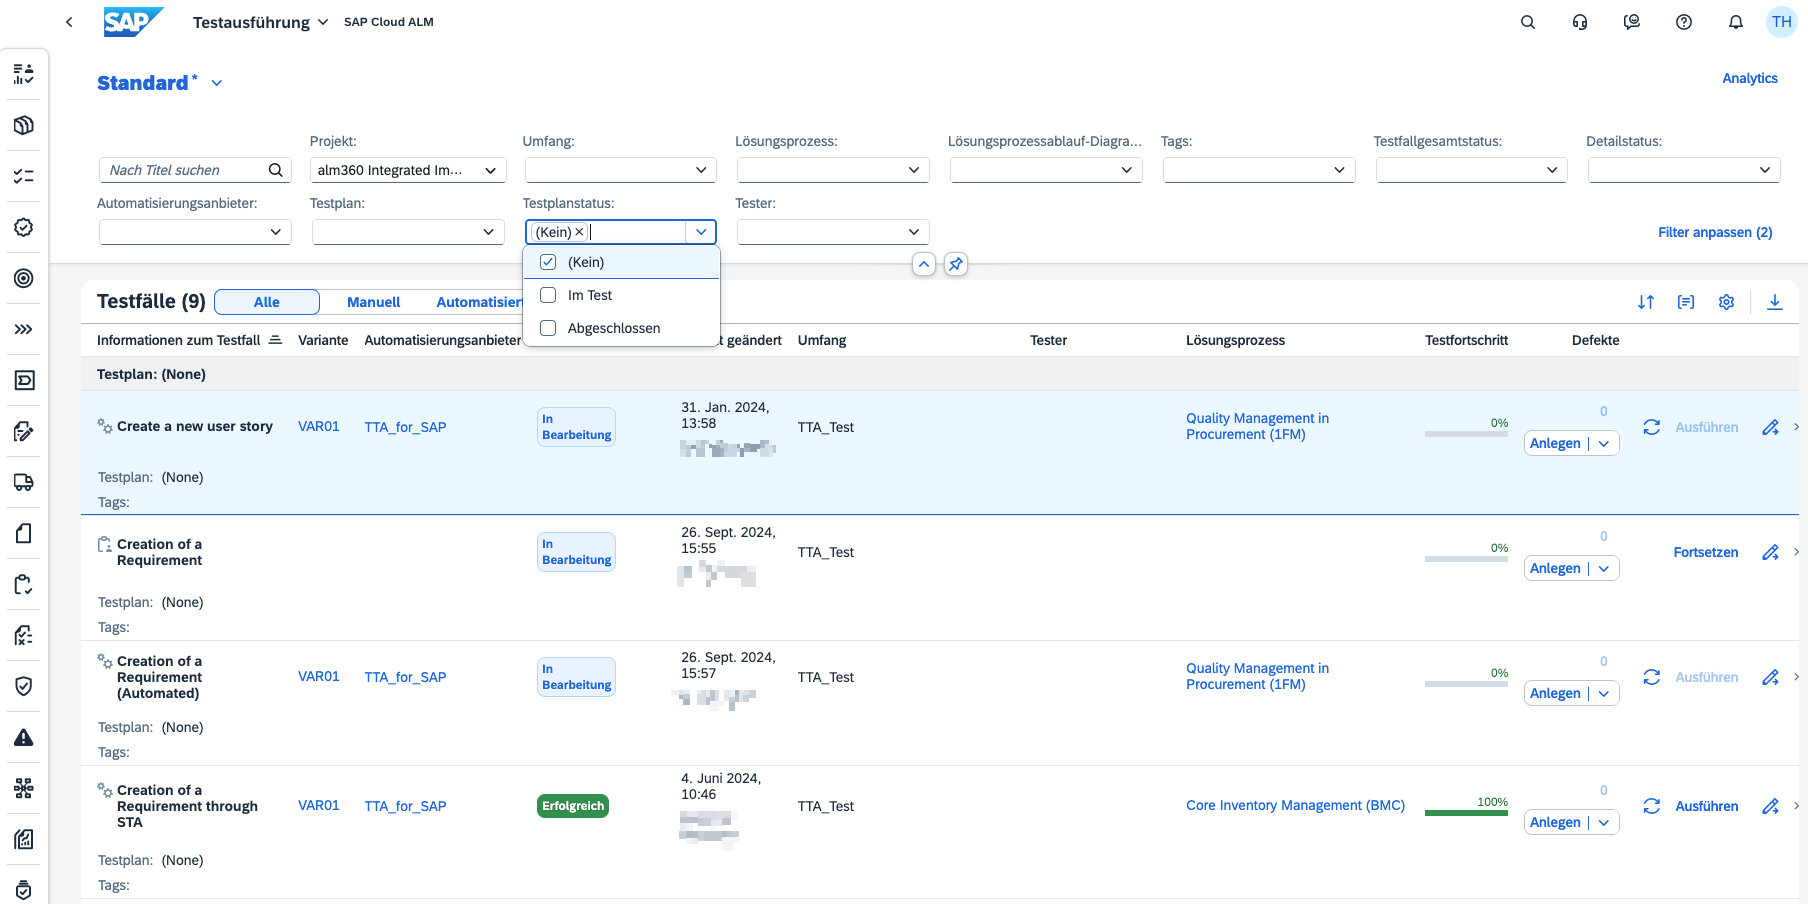
Test Execution allows now to filter by test plan status.
By default, the test case list is filtered by the test plan status In Testing. As a result, test cases without a test plan assignment (status None) and test cases that are assigned to test plans in status Finished aren’t displayed.
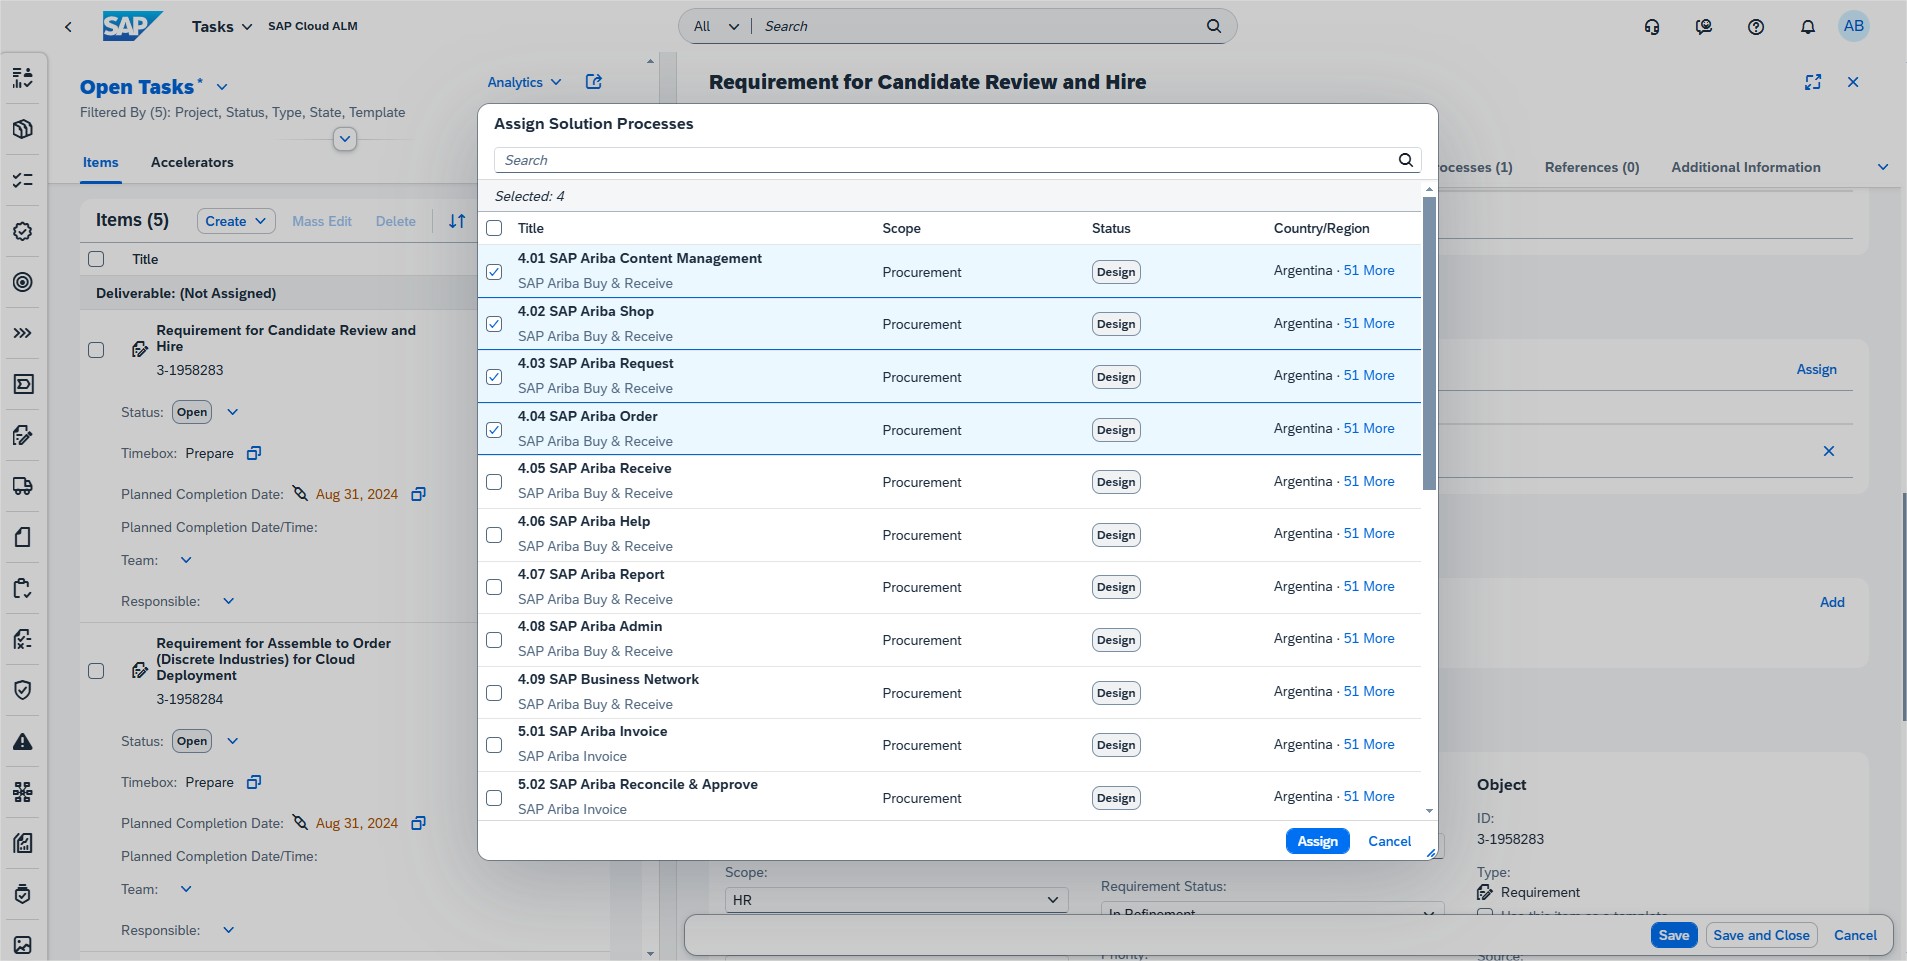
In Tasks it’s now possible to assign multiple solution processes to requirements, defects, user stories, and project tasks.
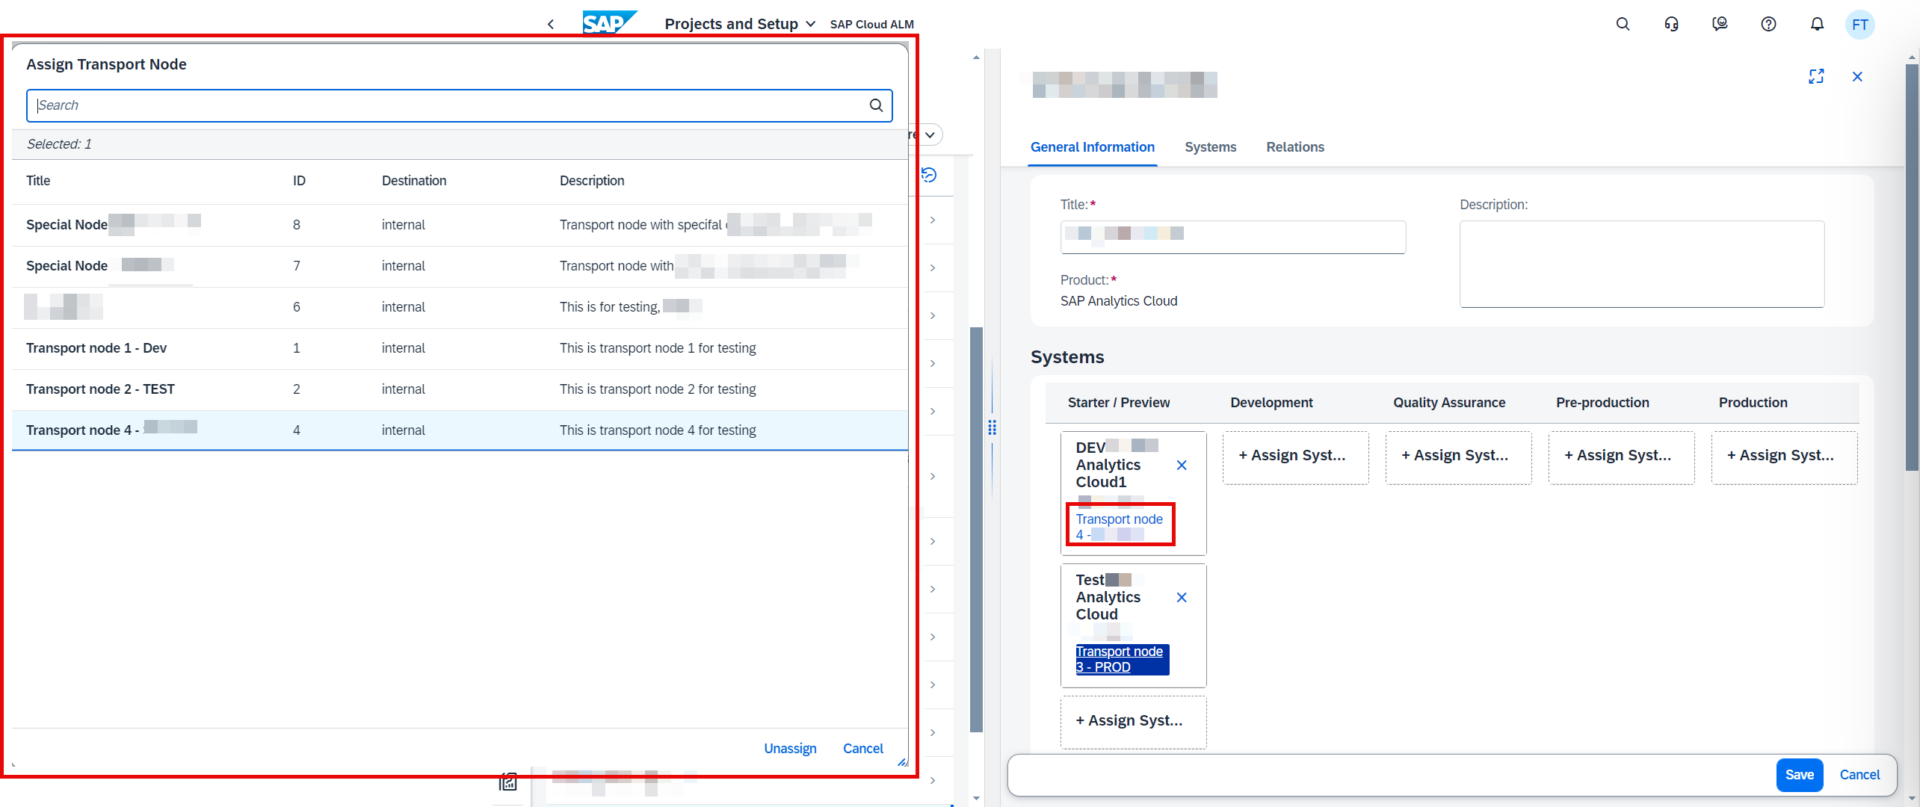
Projects and Setup has now feature to assign transport nodes to the systems in a system group.
Processes allows now to assign the same requirement, user story or project task to multiple solution processes if needed. However, it can be only assigned once within a given solution process (in the context of a project and scope).
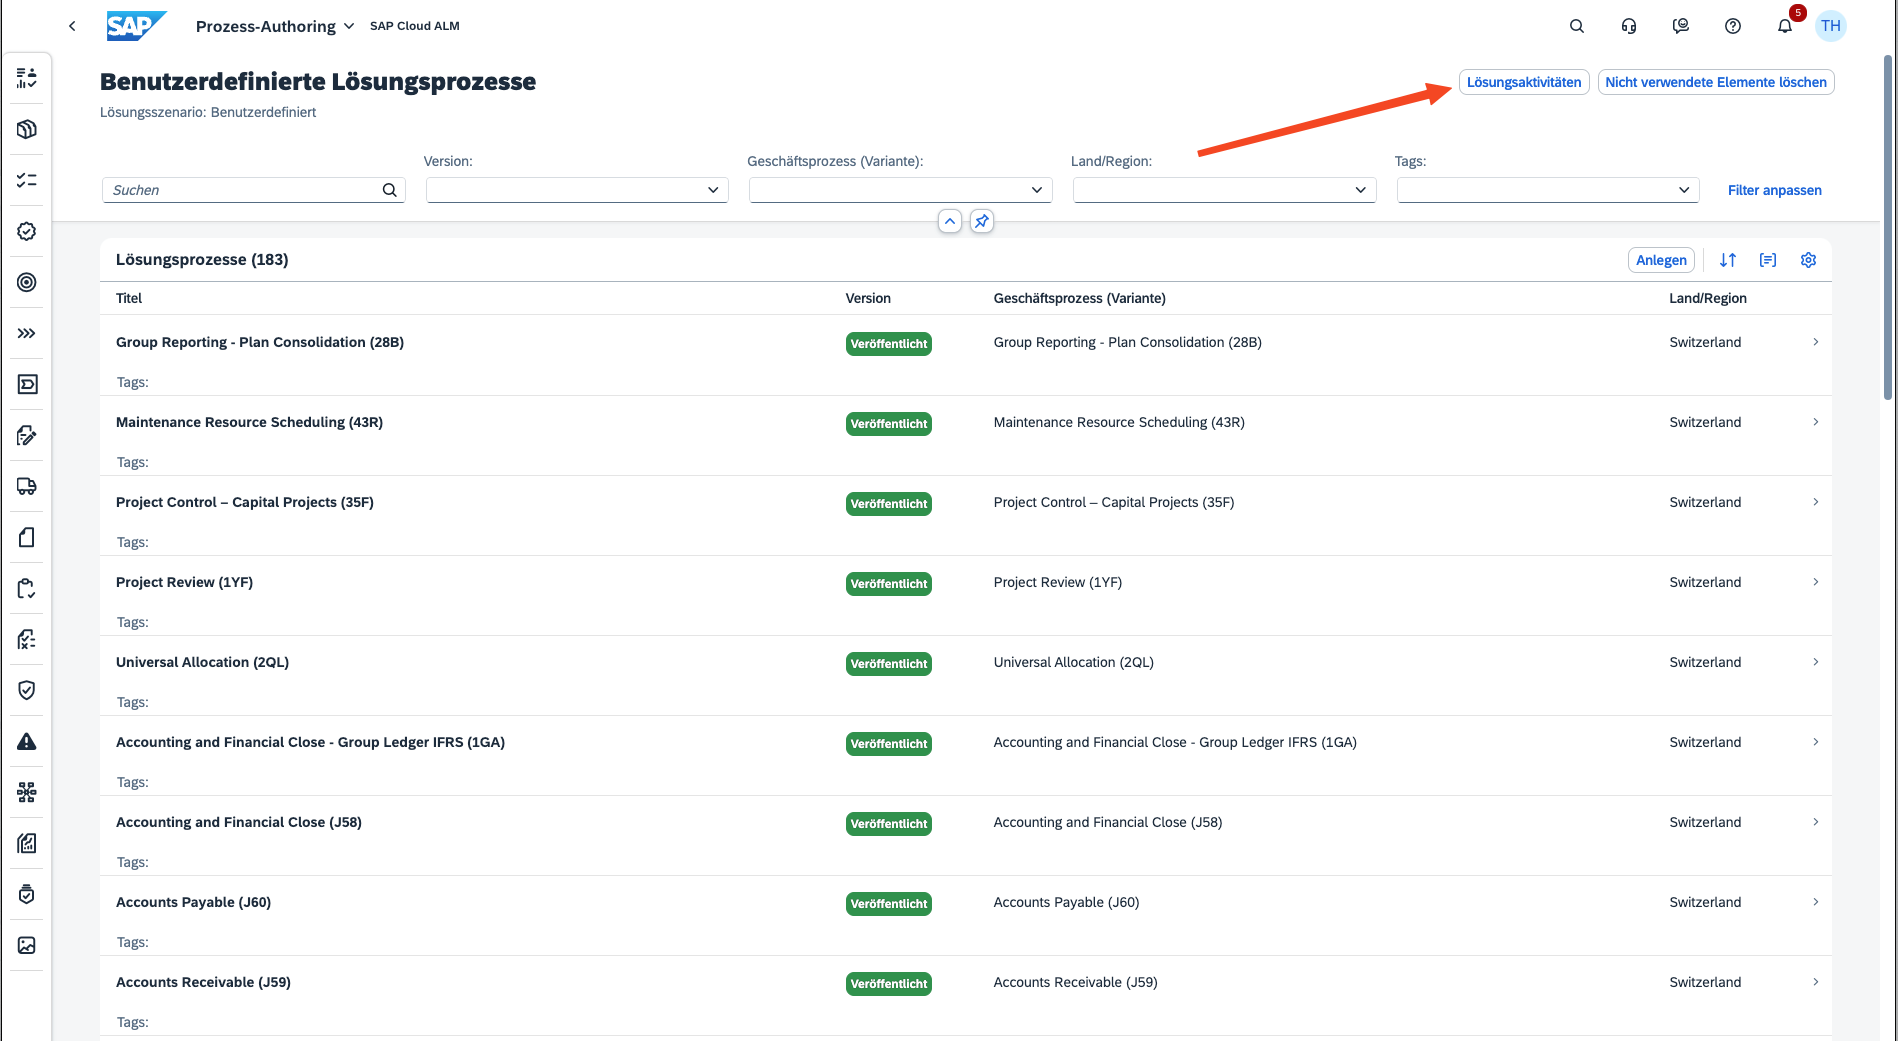
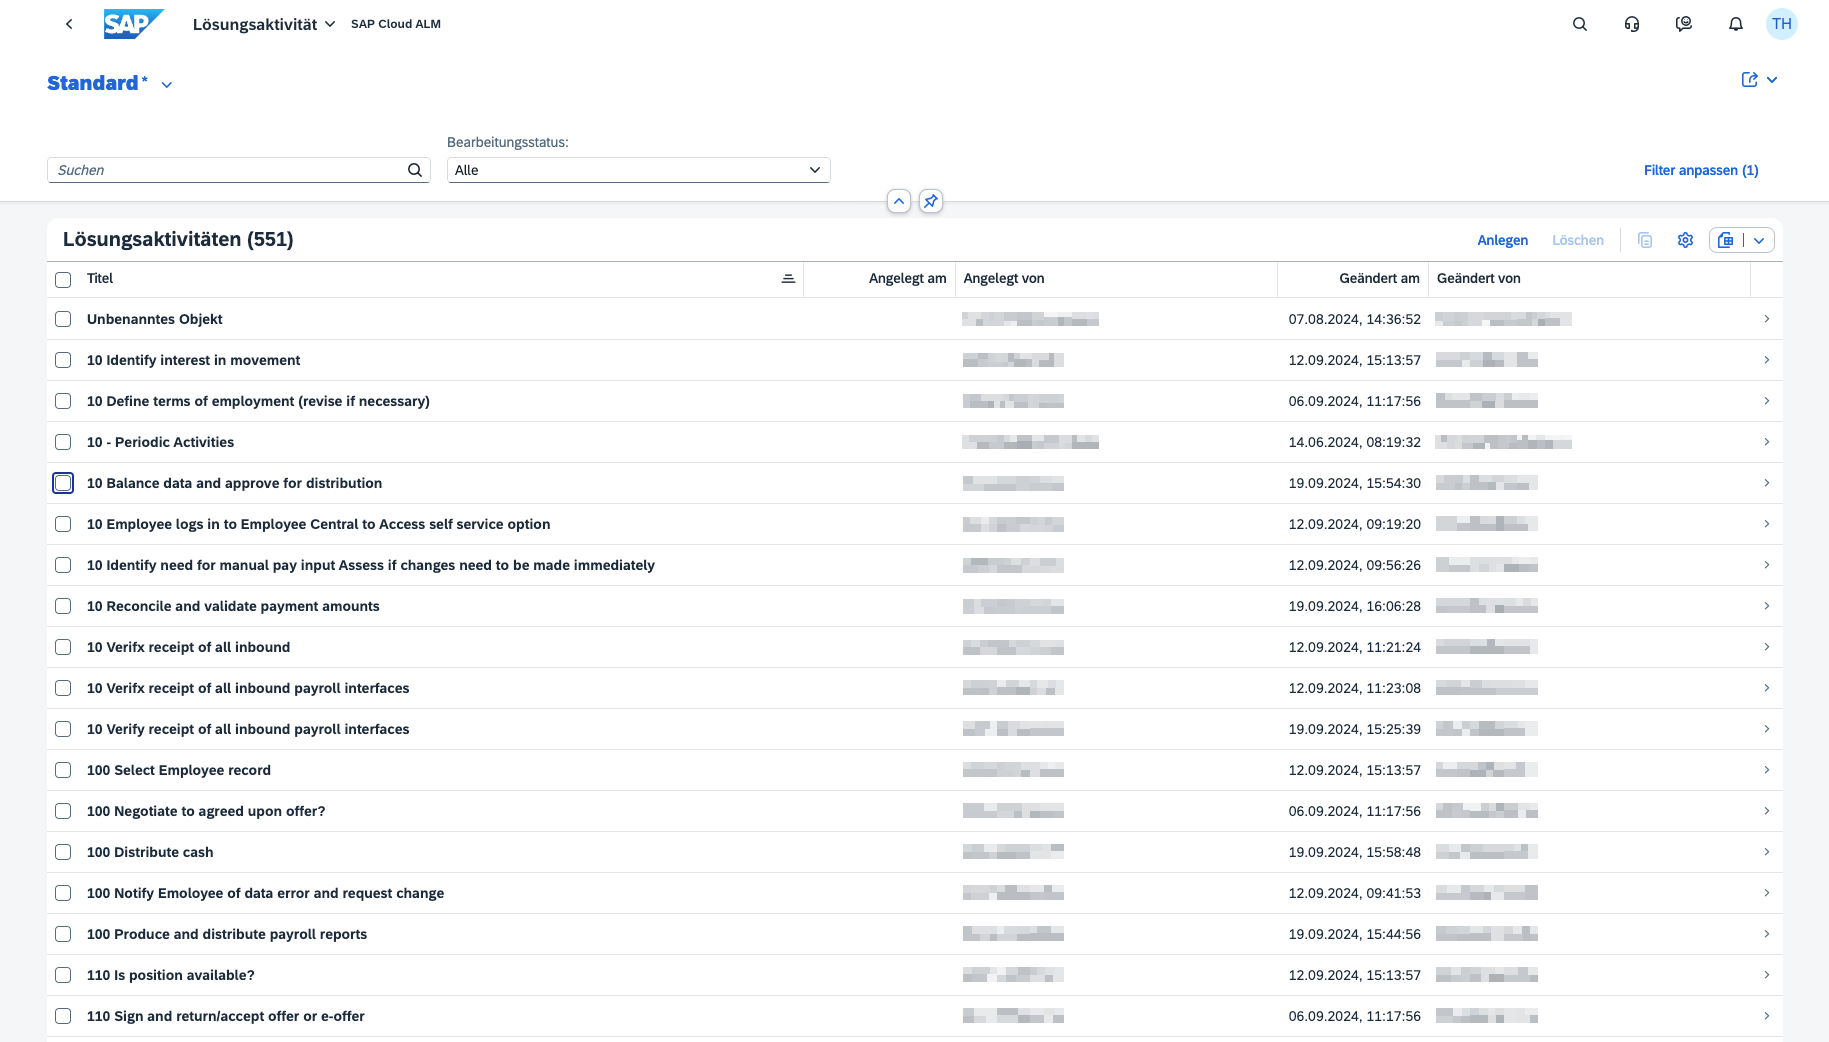
In Process Authoring it’s now possible to display all solution activities in a single list, giving you a central overview for maintaining, creating and deleting your solution activities as required.
In addition to the title, it displays columns showing the date on which the activity was created or changed, and who created or changed it. Similarly, it’s possible to also use corresponding filters and the search field to filter the list of activities.
Some filters and table list columns may be hidden at first. These can be displayed by choosing Adapt filters in the filter bar and the Settings icon in the table header.
From this list, it’s possible to do the following:
Create a new solution activity
Delete individual solution activities that are not used
Mass delete solution activities that are not used
Select a solution activity to display its details in the detailed view and edit its description if required using the Rich Text Editor.
The Delete button only becomes active if the solution activity selected is not used anywhere. When editing an existing solution activity, it’s not possible to edit the solution activity title.
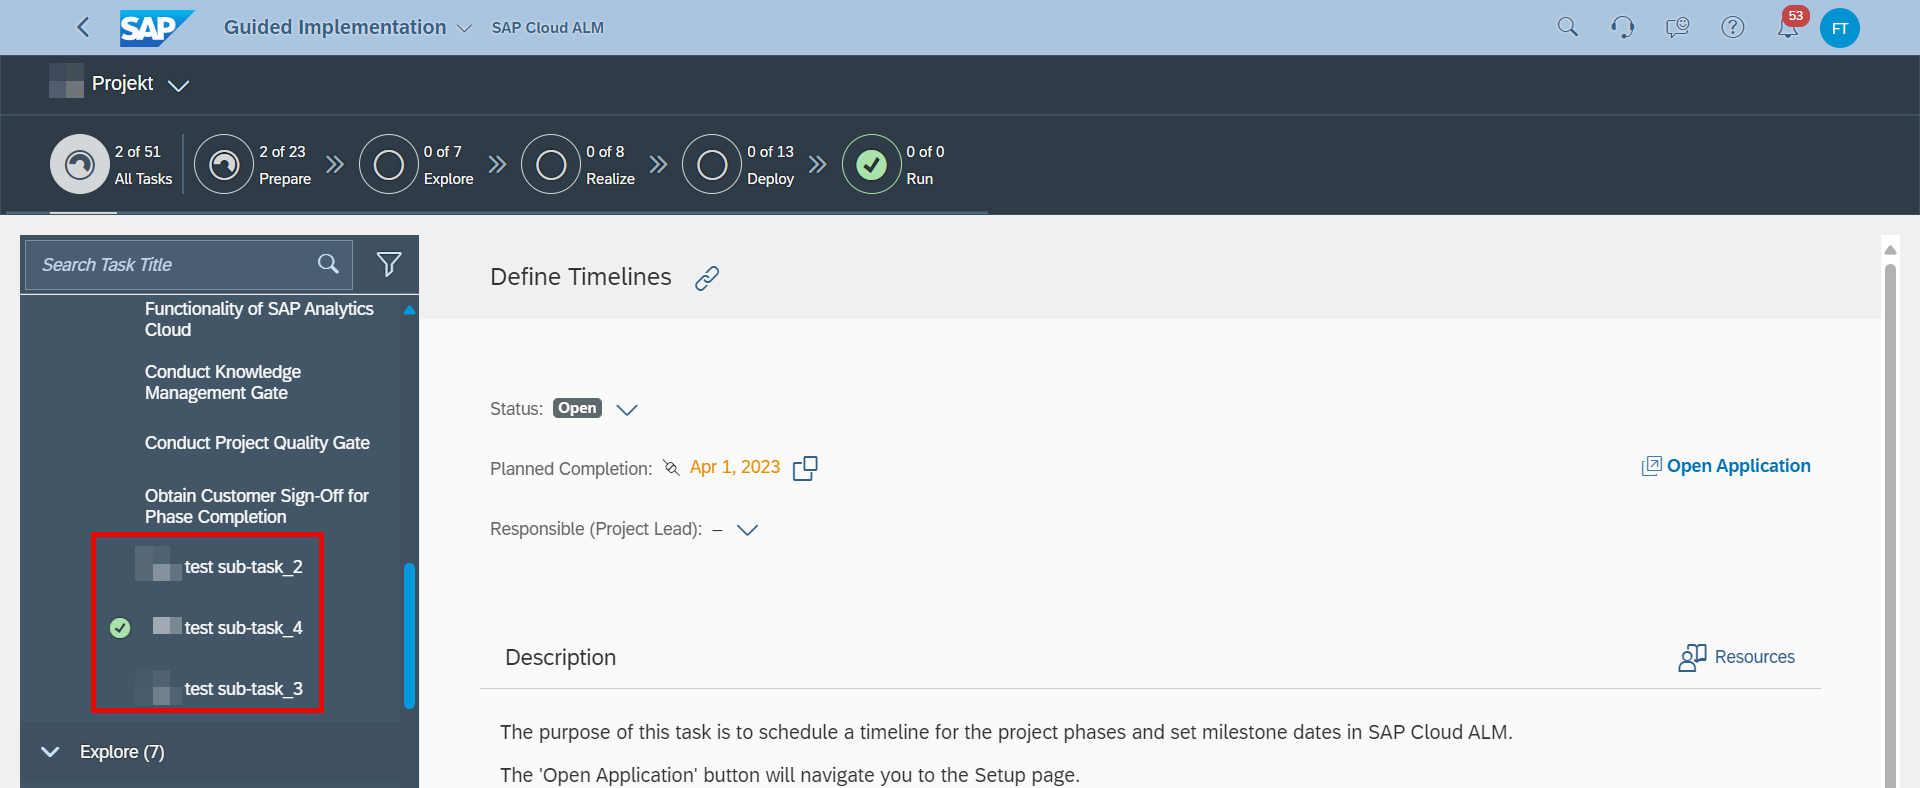
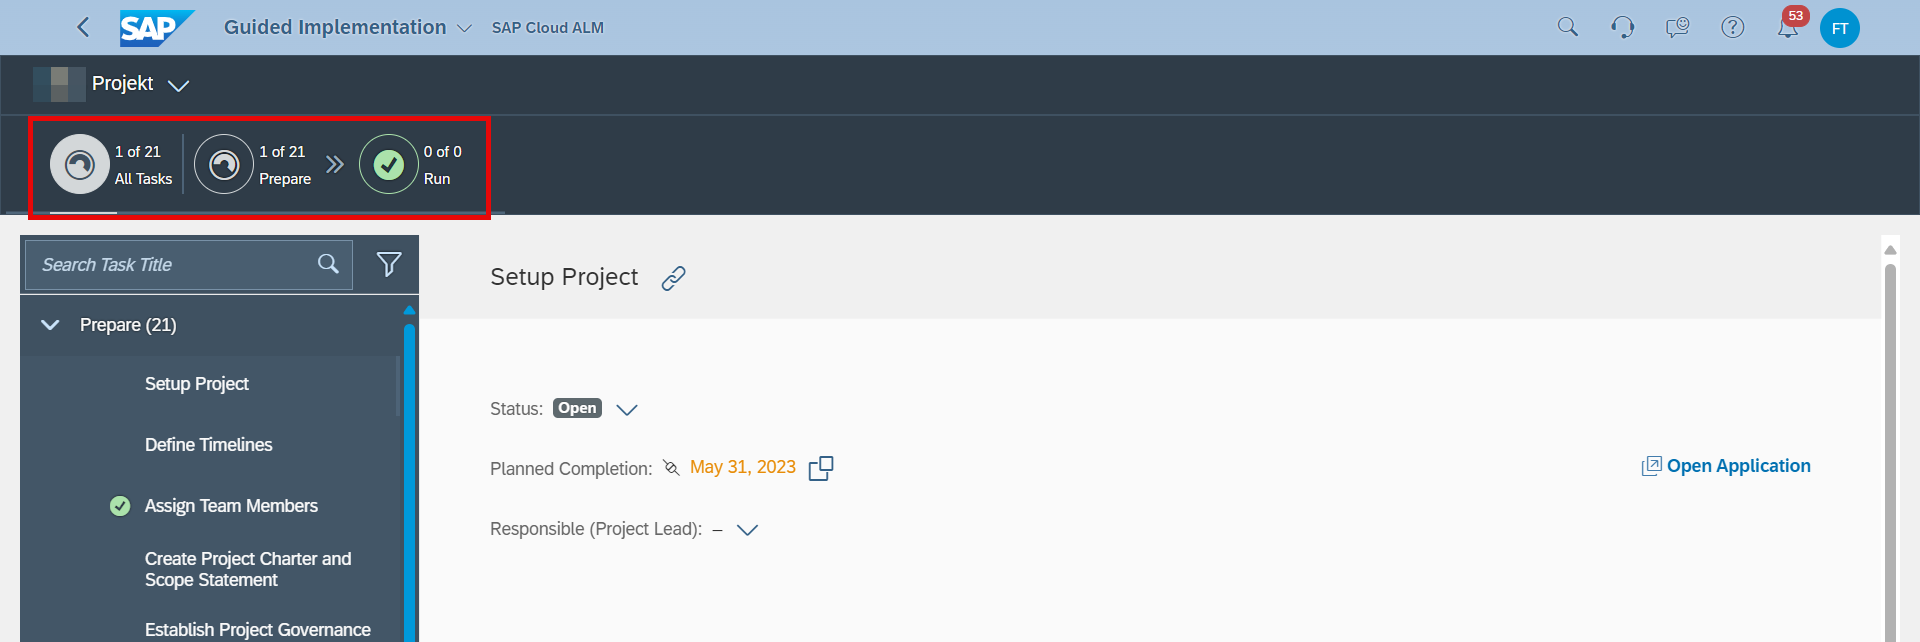
Guided Implementation, which is general something new, has two new features.
Sub-tasks are now displayed in the app to help find items resulting from tasks which need to be accomplished.
Inactive phases which contain tasks are now marked with a prefix. Inactive phases without tasks are not displayed.
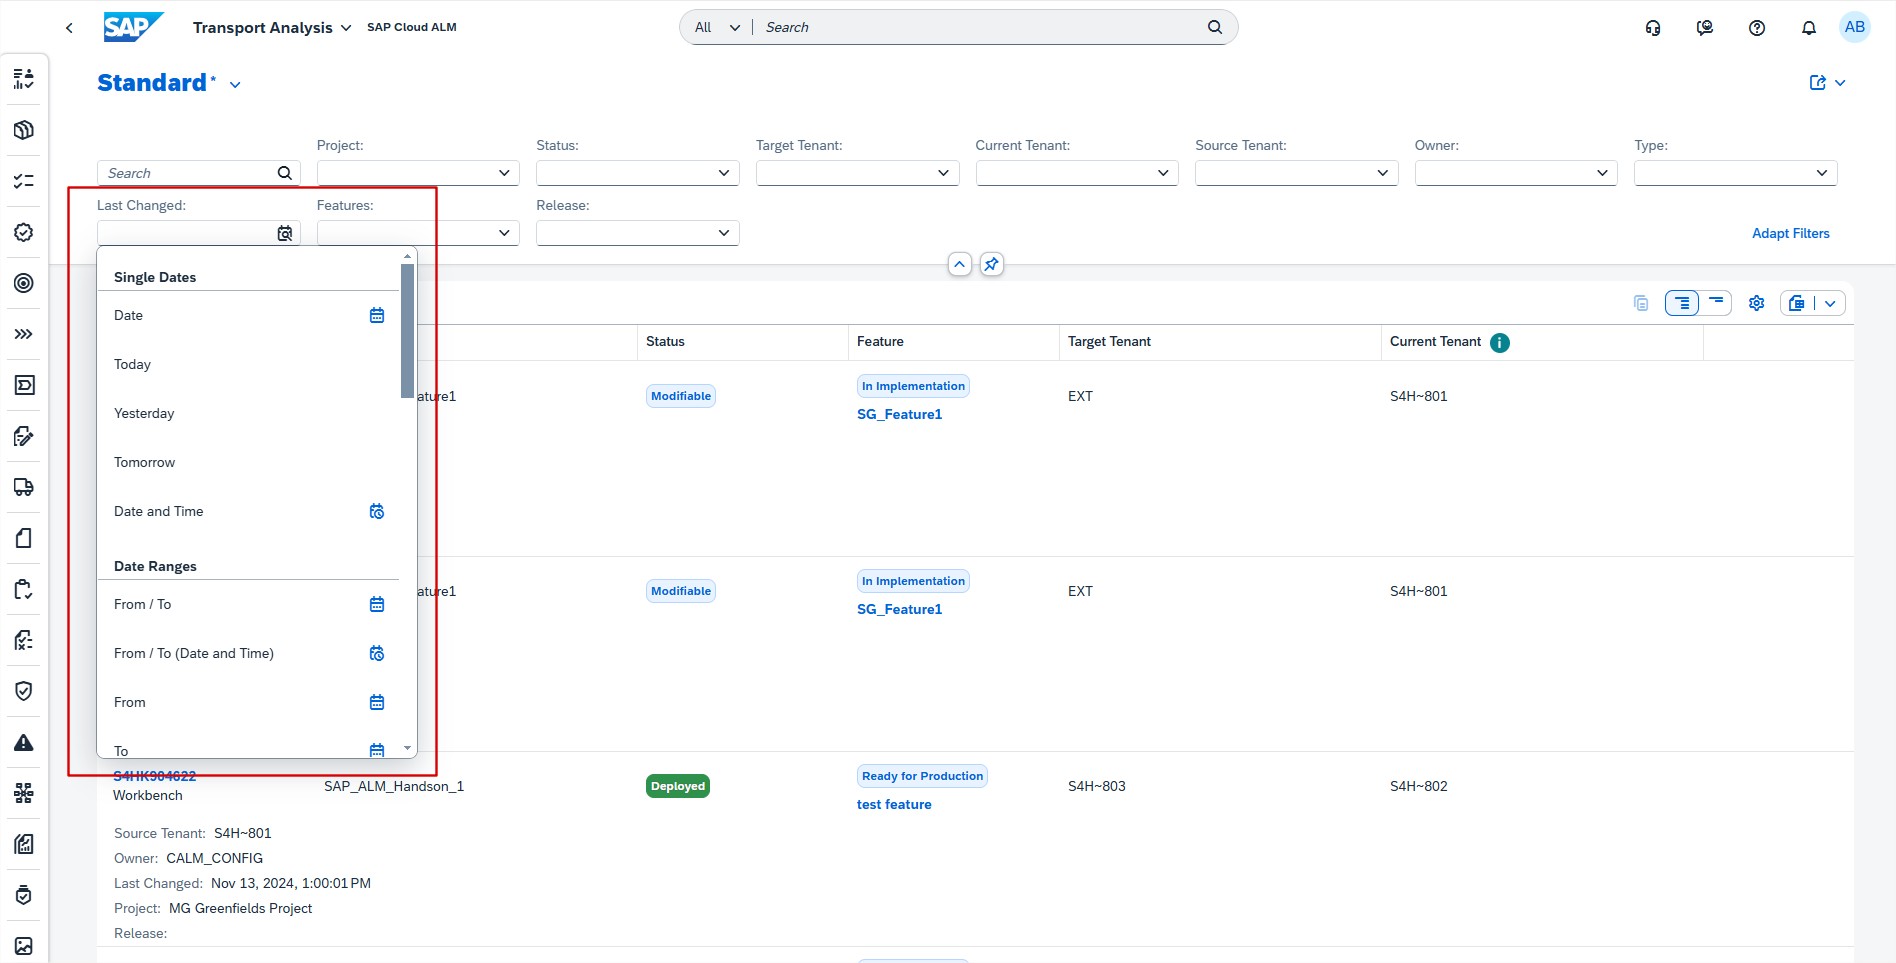
Cross-Project Overview allows now filter by Last Changed in the Transport Analysis app.
We use cookies and similar technologies to improve your experience on our website.