Full of enthusiasm, we ventured into the ALM Cloud and used Selective Data Transfer (SDT) to upload our Solution Documentation (SolDoc) to SAP Cloud ALM (CALM) and (rather laboriously) to our DMS.
SAP Cloud ALM continues to evolve with enhancements that improve transparency, control, and usability across the platform.
The week 12 release brings stronger transformation capabilities in SAP Business Transformation Center, including improved data quality transparency, more flexible migration options, and enhanced tracking throughout the transformation lifecycle. In Operations, updates focus on better monitoring usability, expanded coverage, and improved visualization of execution status. The Implementation area introduces new analytical capabilities, improved traceability, enhanced document editing, and safer process management. Meanwhile, Administration gains improved visibility into identity provider configurations to help ensure a future-ready setup.
Together, these updates help teams better understand their systems, manage complexity more effectively, and execute transformations and operations with greater confidence and control.
SAP Business Transformation Center – Cycle and Monitoring, Data Management, Transition
The SAP Business Transformation Center continues to evolve with enhancements that improve data transparency, flexibility, and overall transformation reliability. Recent updates focus on strengthening data quality analysis, enabling more flexible migration scenarios, and improving tracking and guidance throughout the transformation lifecycle. Together, these improvements help ensure more consistent, efficient, and well-controlled data transformation processes while reducing complexity and increasing confidence in migration outcomes.
Transfer of Generic Object Services in Cycle and Monitoring
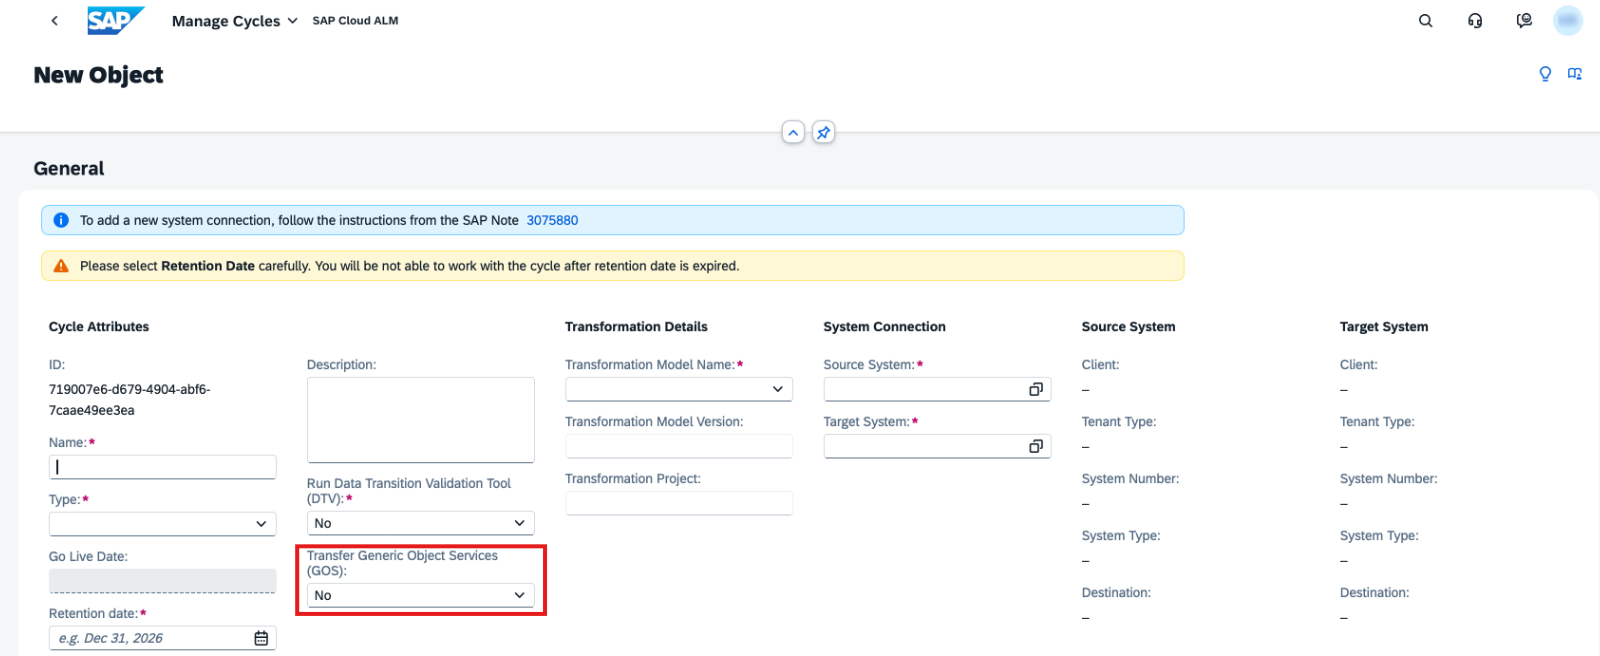
Cycle execution is enhanced with the ability to transfer generic object services alongside business data.
This includes objects such as attachments, notes, and related content, ensuring that important contextual information from source systems is preserved during migration. The transfer will occur during the Postprocessing phase. Keep in mind that once a cycle is created, it’s not possible to change selection regarding whether to transfer generic object services.
This improves data completeness and maintains business context in the target system.
TL;DR:
Generic object services like attachments and notes can now be transferred during cycles, preserving important business context.
Improved Transparency, Filtering, and Run Handling in Data Management
Data Management is enhanced with several improvements that increase transparency, usability, and control over data quality analysis.
A new Calculated On field is now available, allowing users to see the exact timestamp when KPI values were calculated in both Manage Runs and Analyze Data Quality apps.
Additional usability improvements include:
Extraction Progress bar on the Quality Check Run page to track KPI calculation progress
Display of the preselection table name in KPI views for better context
New filters: Extracted On and Extracted By for more precise analysis
Data lifecycle management is also improved:
Runs that have not been executed can now be deleted
Related data assessments can also be removed, enabling clean reconfiguration when needed
These enhancements provide better control over data analysis processes and improve overall transparency of KPI calculations.
TL;DR:
Data Management has now timestamps, progress tracking, new filters, and deletion options, improving transparency and control over data quality analysis.
Enhanced Status Tracking and Dynamic Guidance in Transition
Transition capabilities are improved with more detailed tracking and smarter guidance.
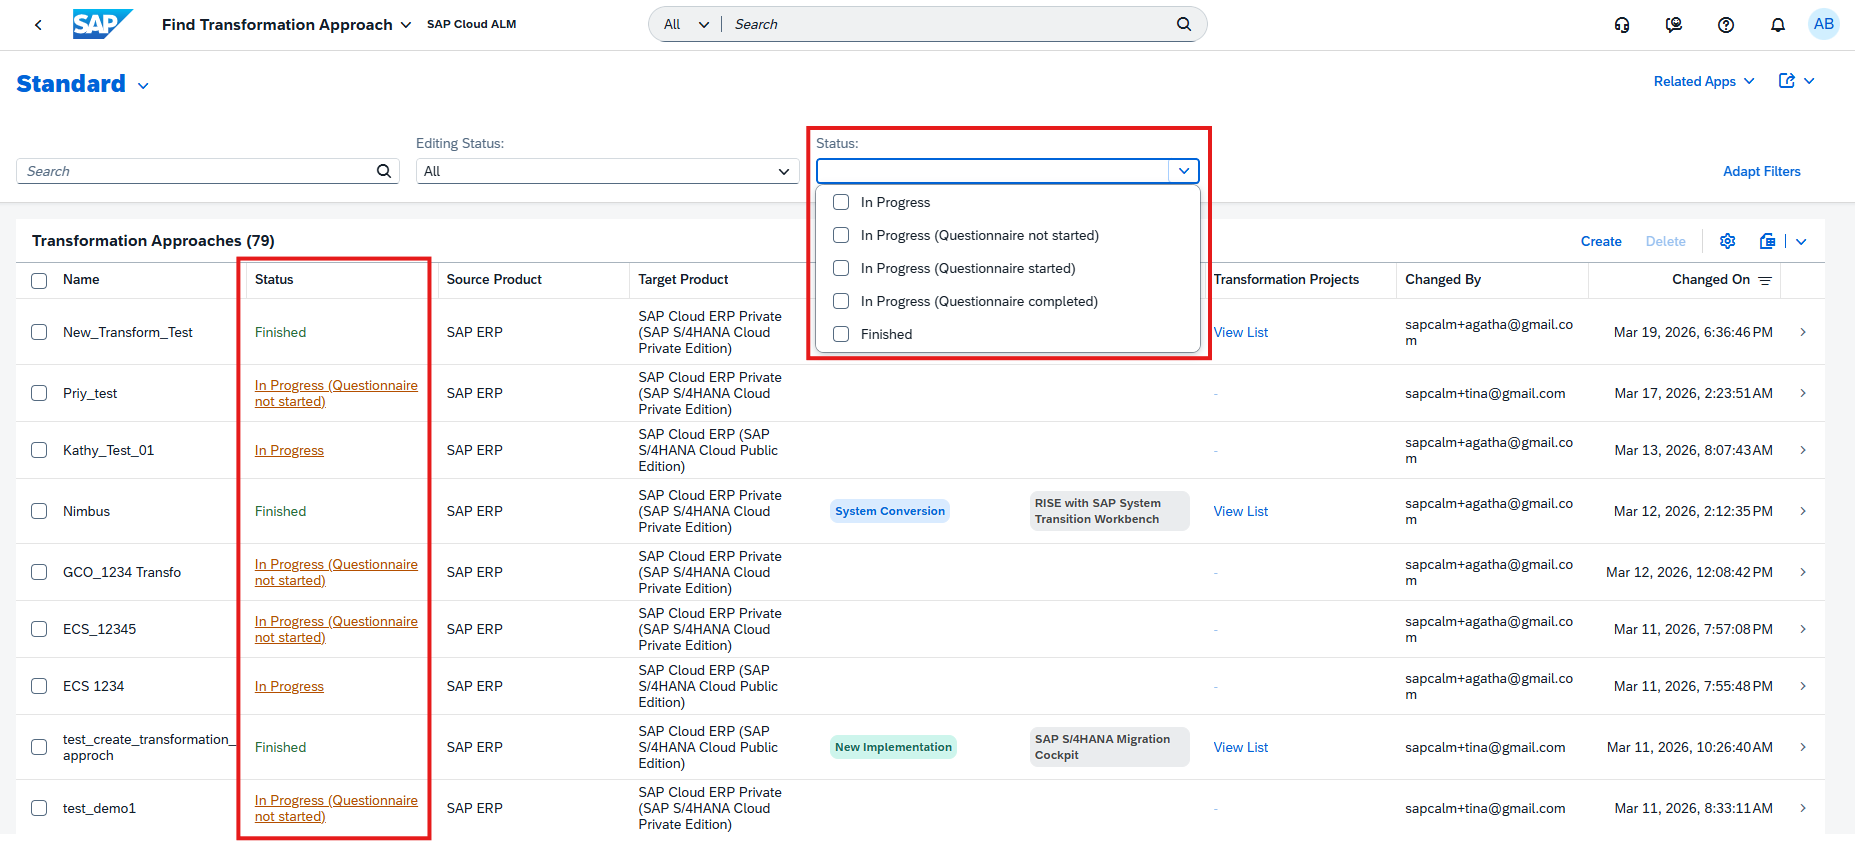
Transformation approaches now support expanded status values, enabling more granular tracking of transformation progress and better visibility into different stages.
In addition, the Get Transformation Guidance questionnaire is now dynamic, adapting questions in real time based on user input. This reduces unnecessary steps and improves the overall experience by making data collection more relevant and efficient.
TL;DR:
Transition updates introduce more detailed status tracking and a dynamic questionnaire, improving visibility and user experience.
Client Mapping and Extended Source System Support
General capabilities are expanded to improve flexibility and compatibility in transformation scenarios.
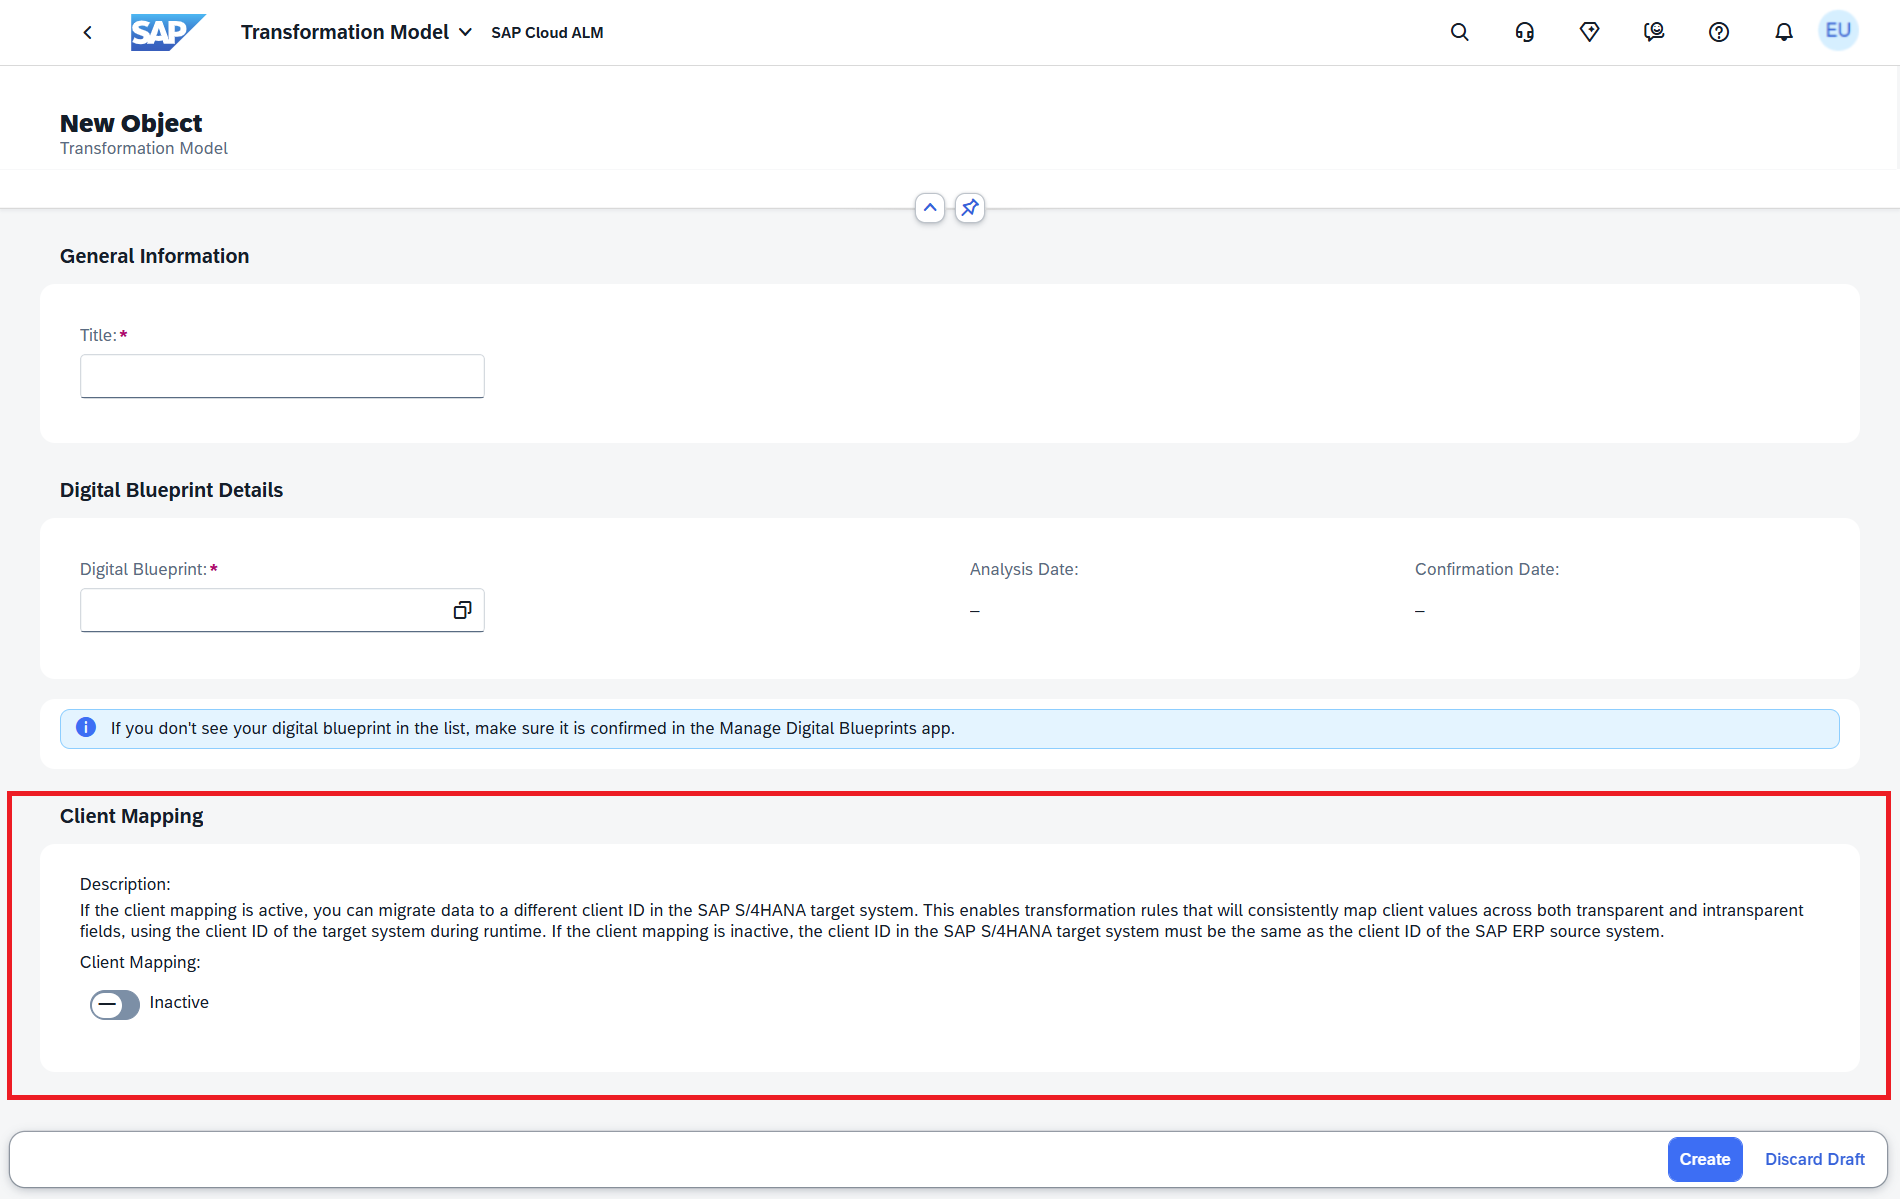
A new client mapping solution pattern removes the requirement for identical client IDs between source and target systems. This allows data migration to different client IDs while automatically handling necessary mappings.
In addition, support is now extended to SAP ERP 6.0 Enhancement Package 7 (EHP7), enabling more source systems to be connected and used in transformation projects.
TL;DR:
New client mapping removes client ID restrictions, and support for SAP ERP EHP7 expands source system compatibility.
Operations – Business Process Monitoring, Integration & Exception Monitoring, Synthetic User Monitoring
The Operations area continues to evolve with enhancements that improve monitoring transparency, usability, and control across the landscape. The latest updates introduce more flexible monitoring views, stronger access control, expanded monitoring coverage, and improved visualization of execution status – helping teams better understand system behaviour and respond more effectively to operational events.
Custom Views, KPIs, and Improved Sorting in Business Process Monitoring
Business Process Monitoring is enhanced with new capabilities that improve usability, personalization, and monitoring coverage.
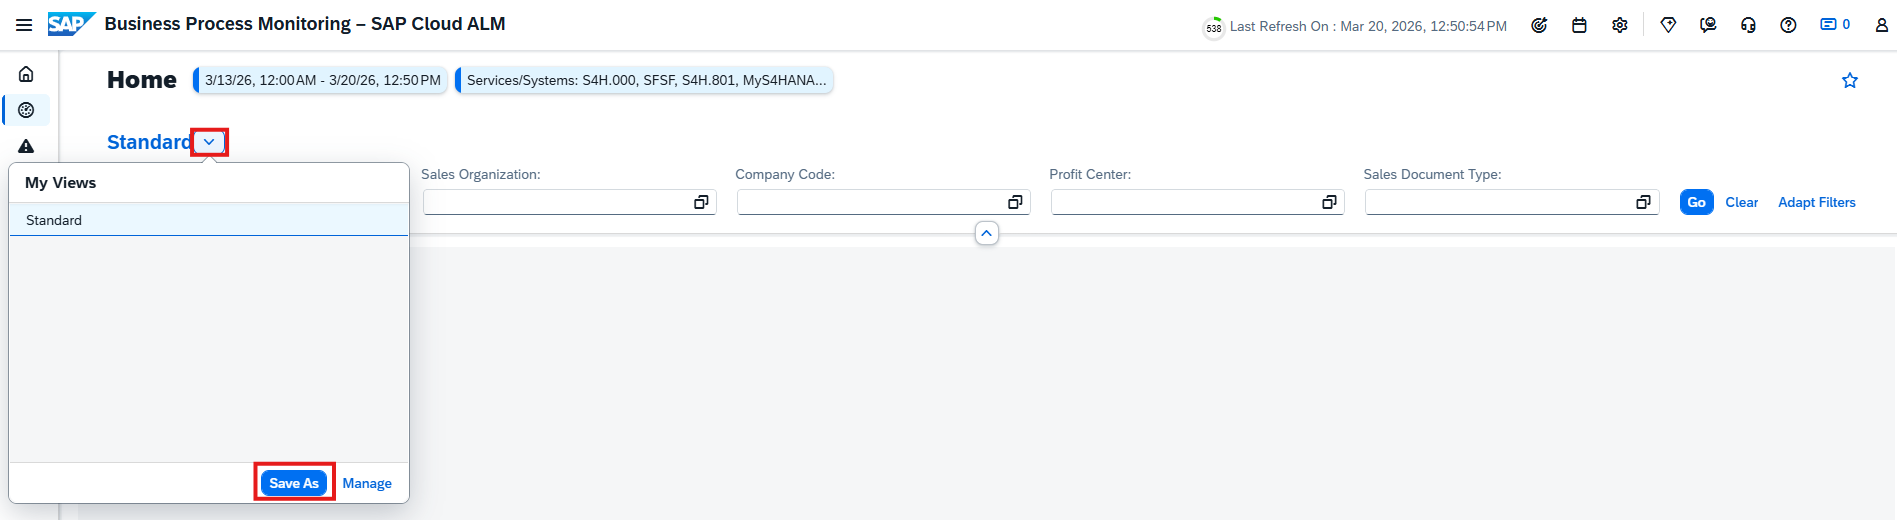
Users can now create and save custom views on the Monitoring page by storing table settings such as filters, columns, and layouts. Multiple views can be saved and managed, and a preferred view can be set as the default, allowing faster access to relevant monitoring data.
Monitoring coverage is extended with new KPIs for SAP Complaint Handling, including:
Open Customer Complaints
Open Supplier Complaints
Total Open Complaints
These KPIs are automatically available once the required setup and data collection are in place and can be used within end-to-end processes such as Lead to Cash and Source to Pay.
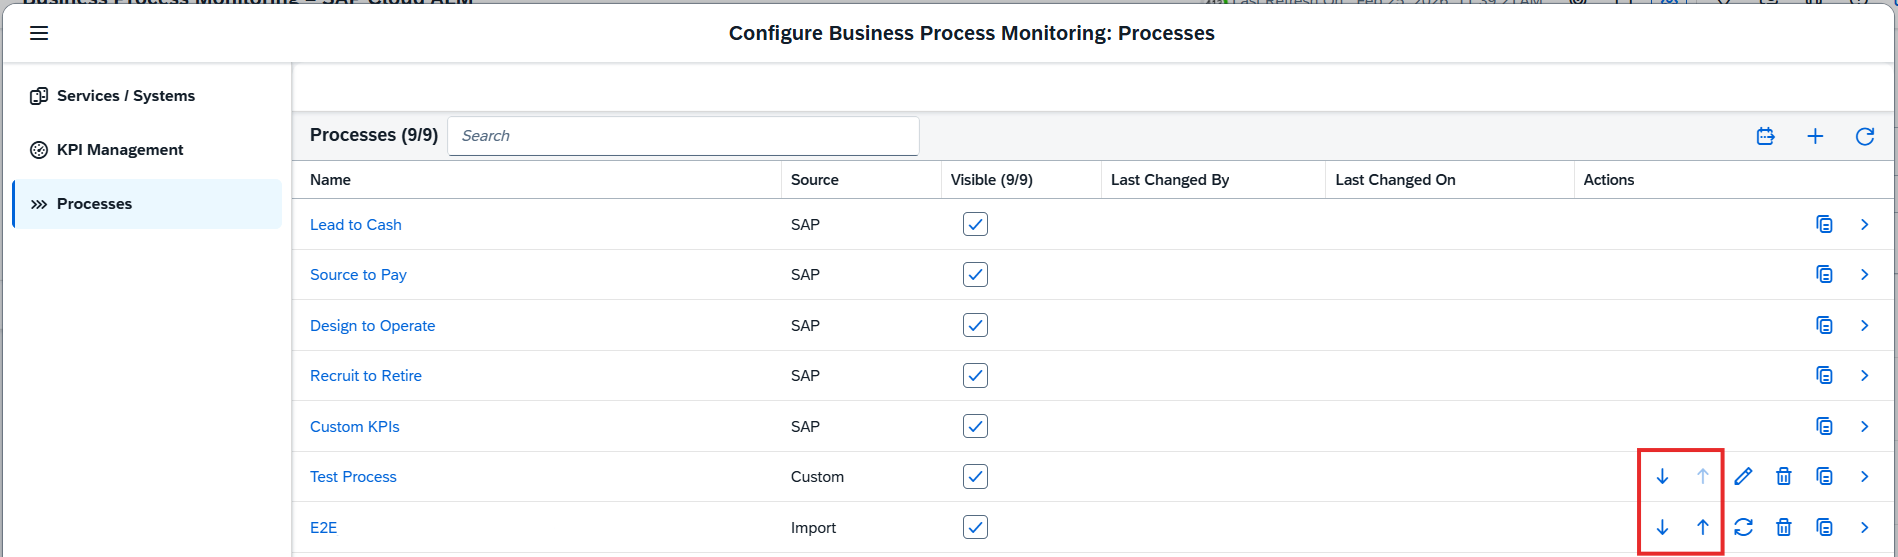
In addition, users can now customize the sorting order of custom processes, their related nodes, and assigned KPIs. This configuration is reflected across the Home and Monitoring pages, enabling a more tailored and structured monitoring experience.
TL;DR:
Business Process Monitoring now supports custom views, introduces new SAP Complaint Handling KPIs, and allows configurable sorting of processes and KPIs for a more personalized monitoring experience.
Access Control, Search Enhancements, and Extended Monitoring Coverage in Integration & Exception Monitoring
Integration & Exception Monitoring is enhanced with improvements in security, usability, and monitoring capabilities.
Access control is now enabled for the app, ensuring that users can only view data for services and systems assigned to them via the Access Control List in the Landscape Management app. This strengthens data security and ensures users only access relevant landscape objects.
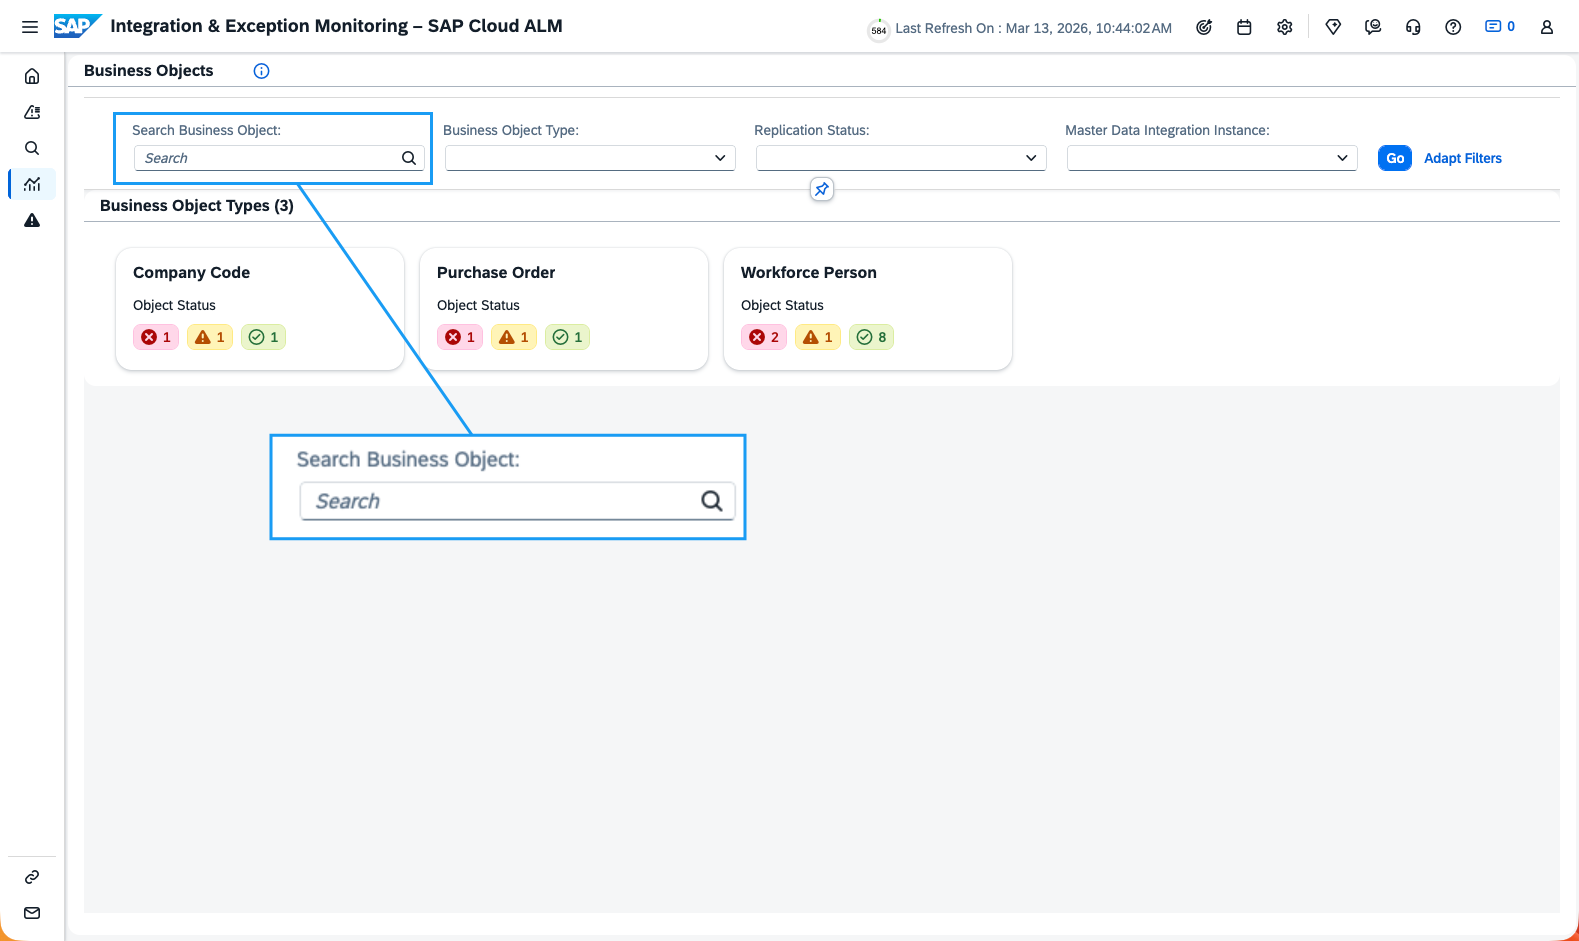
Usability is improved with a new search functionality in the Business Objects page. Users can now search for business objects using a Provider ID or Object ID, supporting both full and partial searches. Results are grouped by object type, allowing quick navigation to the relevant object details.
Monitoring coverage is also extended with support for SAP Integration Suite (Edge Integration Cell). Users can now monitor incoming and outgoing messages, access detailed status overviews, and drill down into individual messages to investigate issues more efficiently.
TL;DR:
Integration & Exception Monitoring now includes access control, enhanced search by object ID, and support for SAP Integration Suite (Edge Integration Cell) for improved security, usability, and monitoring coverage.
Visual Execution Status Indicators in Synthetic User Monitoring
Synthetic User Monitoring now introduces visual execution status indicators to improve transparency of scenario executions.
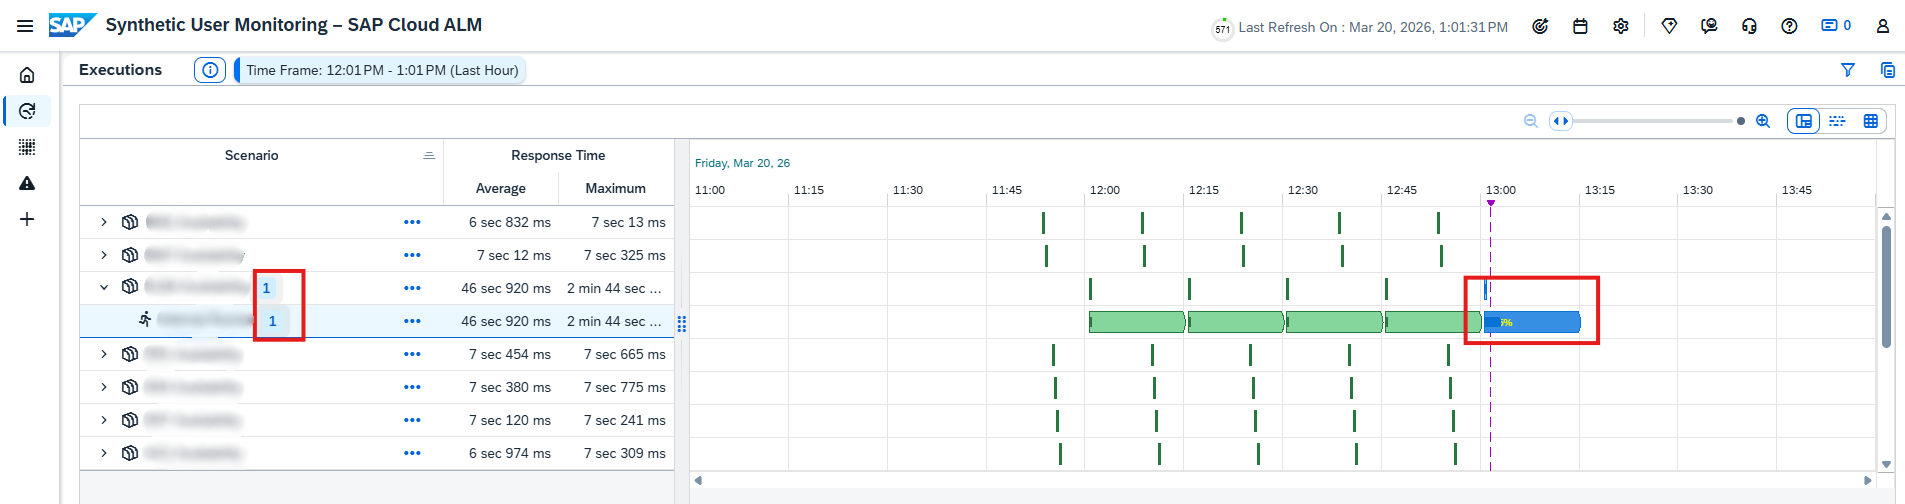
Active executions are displayed using progress bars in Gantt charts, providing a clear timeline view of ongoing activities. In addition, execution counters in tree views give a quick overview of execution status across monitored scenarios.
These visual enhancements make it easier to track execution progress and quickly understand the current state of synthetic monitoring scenarios.
TL;DR:
Synthetic User Monitoring now includes progress bars and execution counters for clearer, real-time visibility into scenario execution status.
Implementation – Analytics, Documents, Process Authoring
The Implementation area continues to evolve with updates that enhance transparency, usability, and control across project execution. The latest improvements introduce new analytical capabilities for risk evaluation, improved traceability and ownership visibility, richer document editing features, and safer process management through harmonized deletion handling – helping teams manage implementation work more efficiently and with greater confidence.
New Risk Distribution App in Analytics
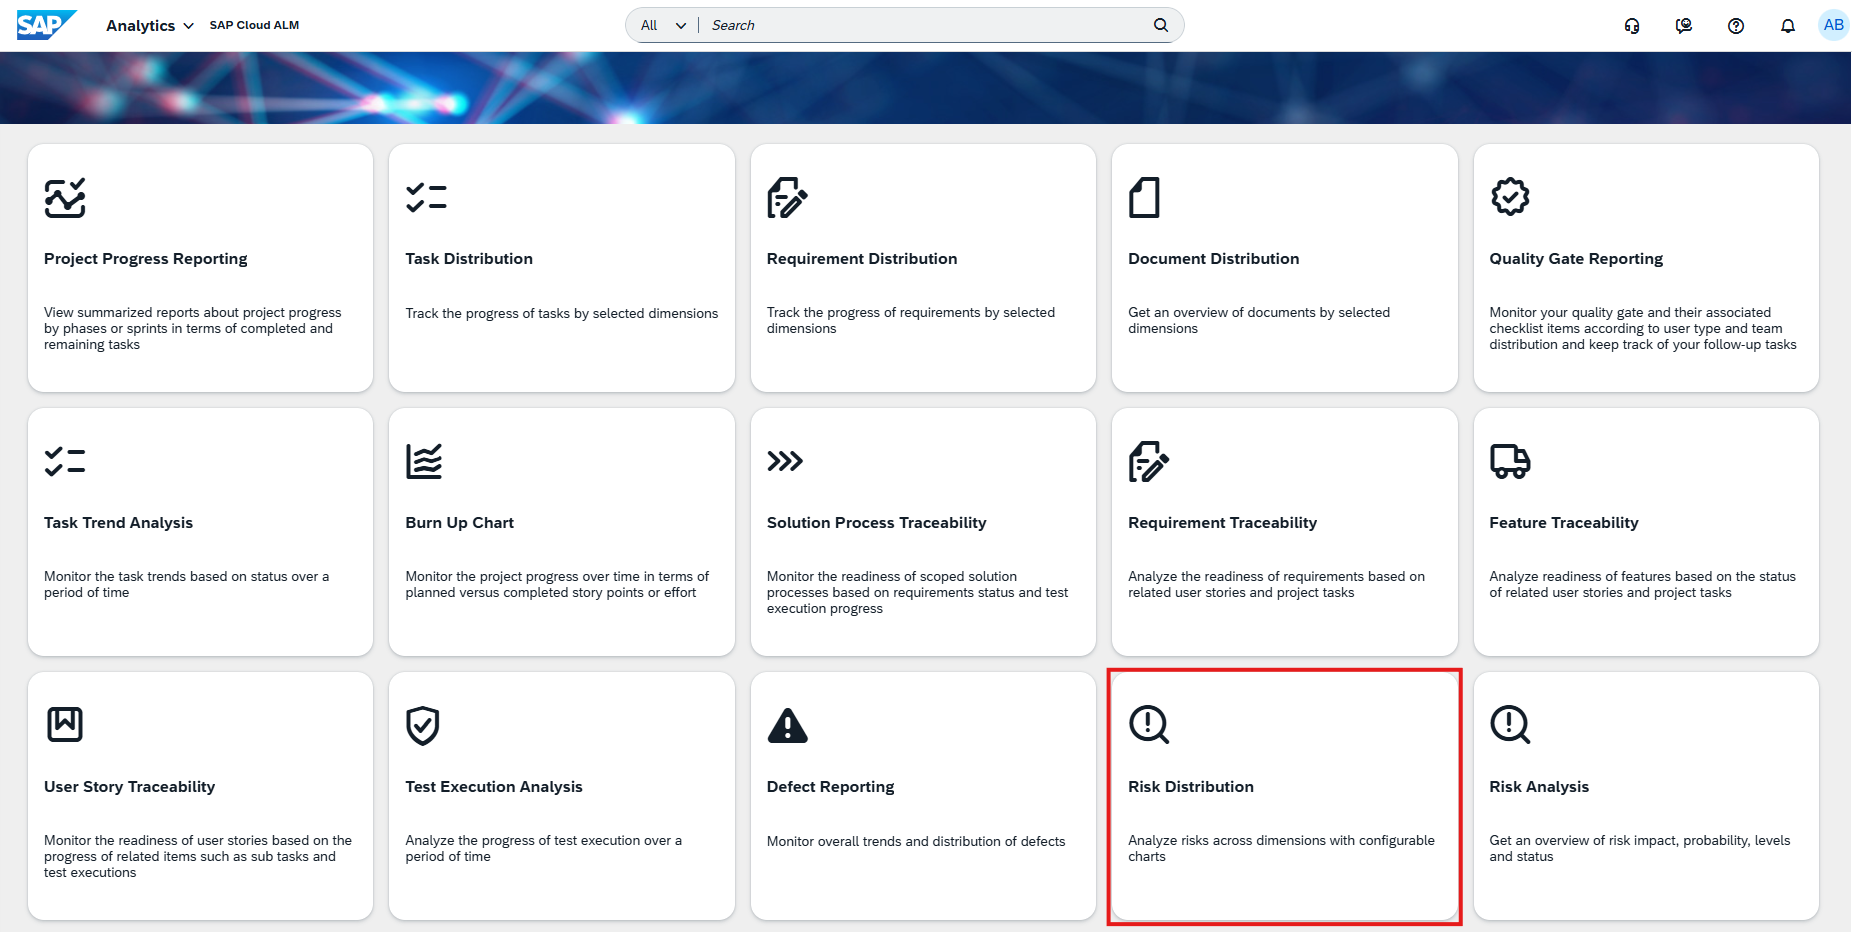
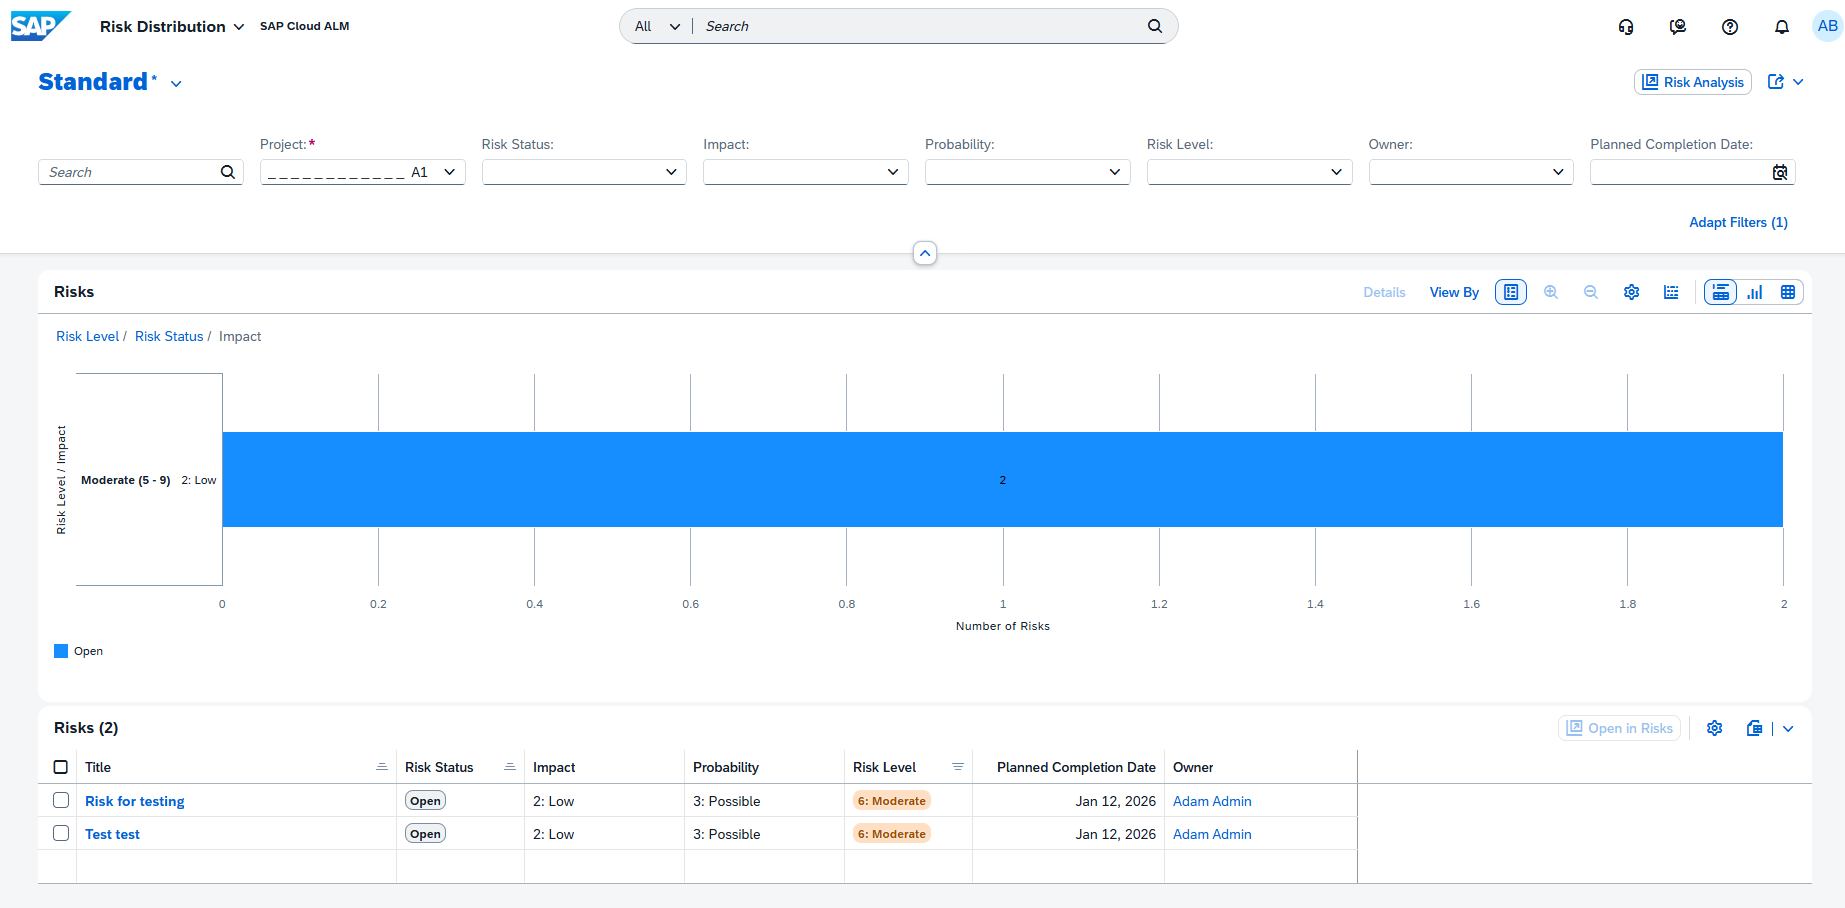
A new Risk Distribution app is now available in the Analytics, providing enhanced capabilities for analyzing project risks.
The app enables teams to analyze and compare risk patterns across different categories using interactive chart visualizations. With flexible chart options, it helps identify trends, concentrations, and high-risk areas, supporting more informed decision-making and prioritization.
By visualizing risk distribution data, project teams gain a clearer understanding of how risks are spread across the project and where attention is most needed.
TL;DR:
The new Risk Distribution app provides interactive charts to analyze risk patterns and identify high-risk areas across projects.
Enhanced Traceability with Ownership and Status Details in Analytics
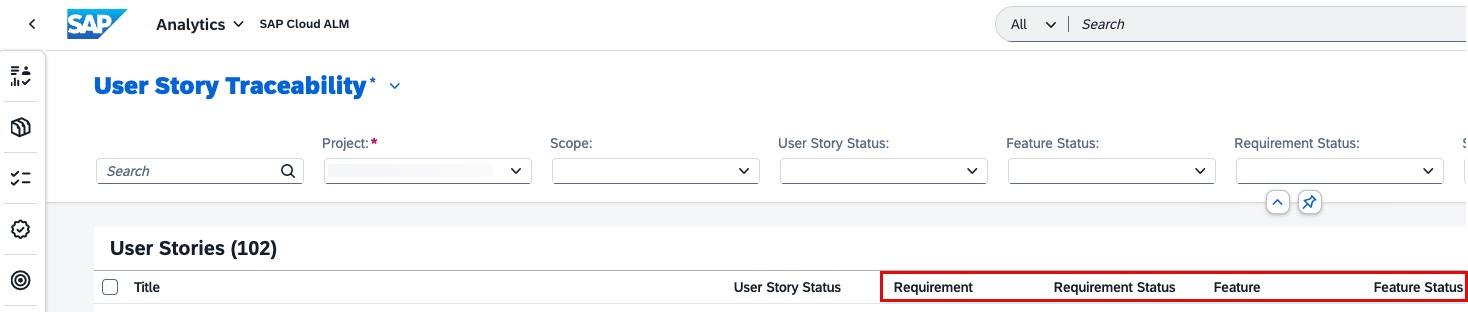
Traceability apps in the Analytics are enhanced to provide better visibility into ownership and more granular status tracking. New Owner and Responsible columns are now available in the following apps:
Solution Process Traceability
Requirement Traceability
Feature Traceability
User Story Traceability
These columns are hidden by default and can be enabled as needed, allowing teams to better understand who is accountable for each artifact.
In addition, the User Story Traceability app now separates previously combined status fields into four distinct columns:
Requirement
Requirement Status
Feature
Feature Status.
This change enables more precise filtering, sorting, and analysis across requirements and features.
Together, these enhancements improve transparency and make it easier to track ownership and status across project elements.
TL;DR:
Traceability apps now include optional Owner/Responsible columns and more detailed status separation, improving visibility and analysis of project artifacts.
Enhanced Text Formatting in Documents
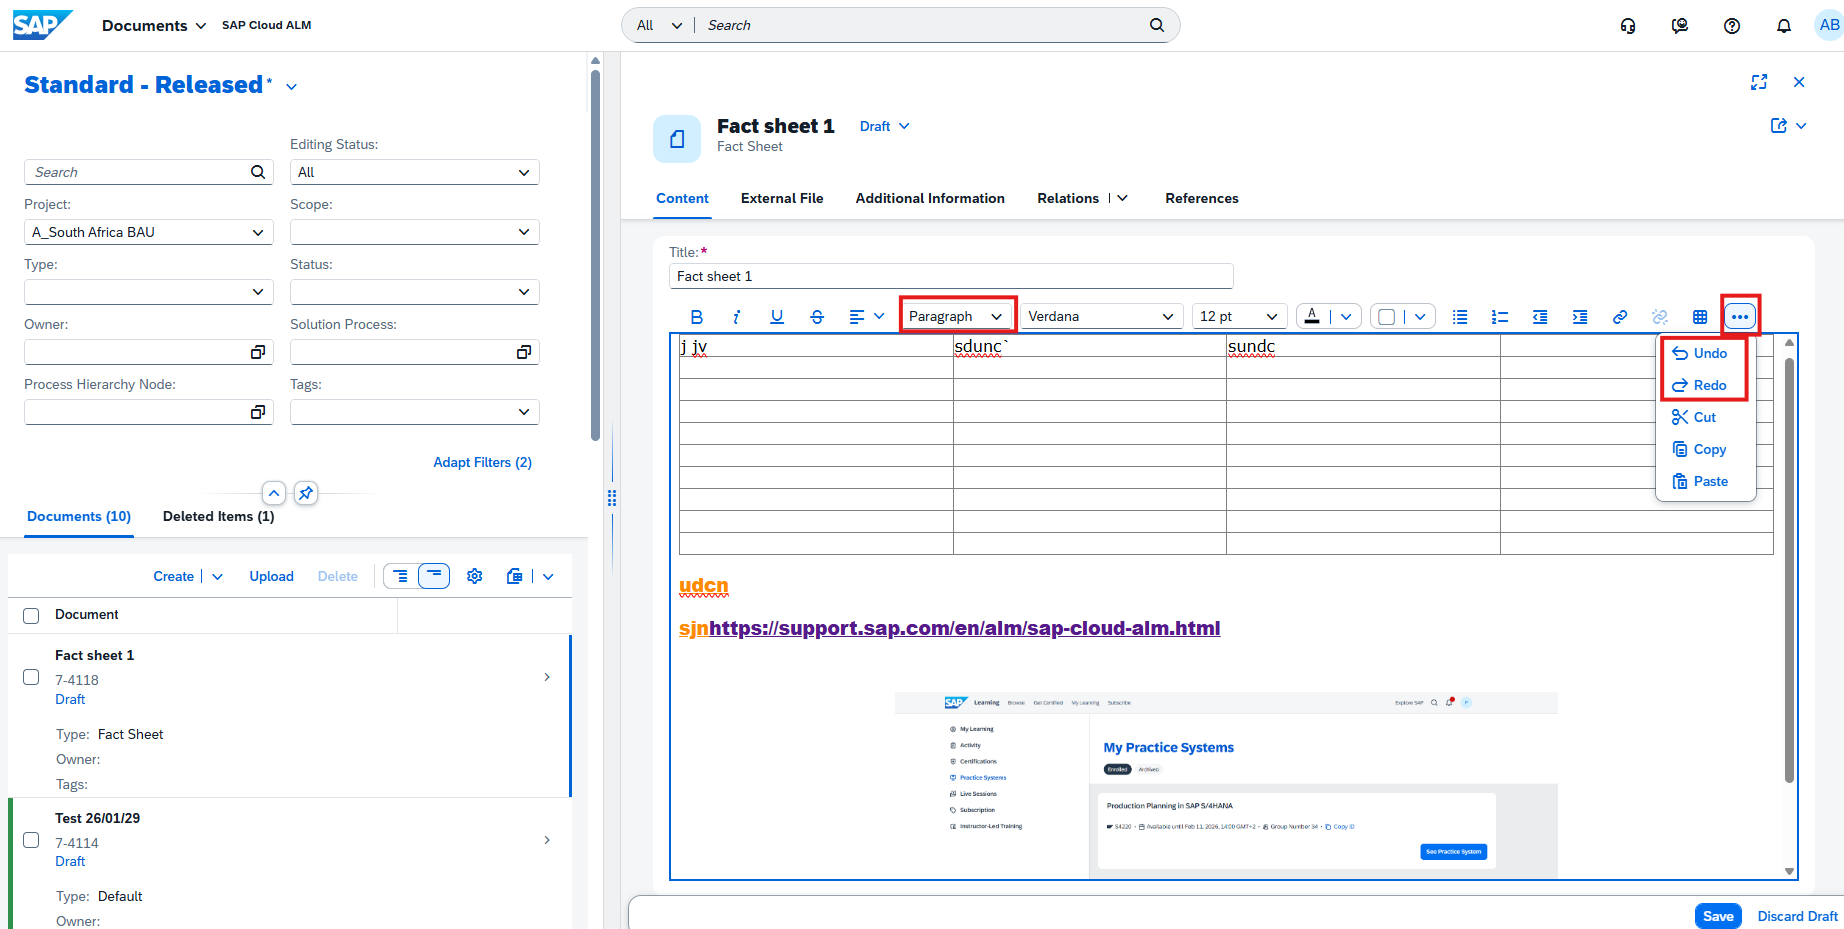
The Documents app now includes improved editing capabilities in its Rich Text Editor, making document creation and formatting more flexible.
New features include:
Undo and redo functionality for easier editing
Paragraph and heading formatting options for better content structure
These enhancements provide greater control over document formatting and improve the overall editing experience.
TL;DR:
The Documents app now supports undo/redo and enhanced text formatting, making document editing more flexible and user-friendly.
Harmonized two-step deletion for custom solution processes in Process Authoring
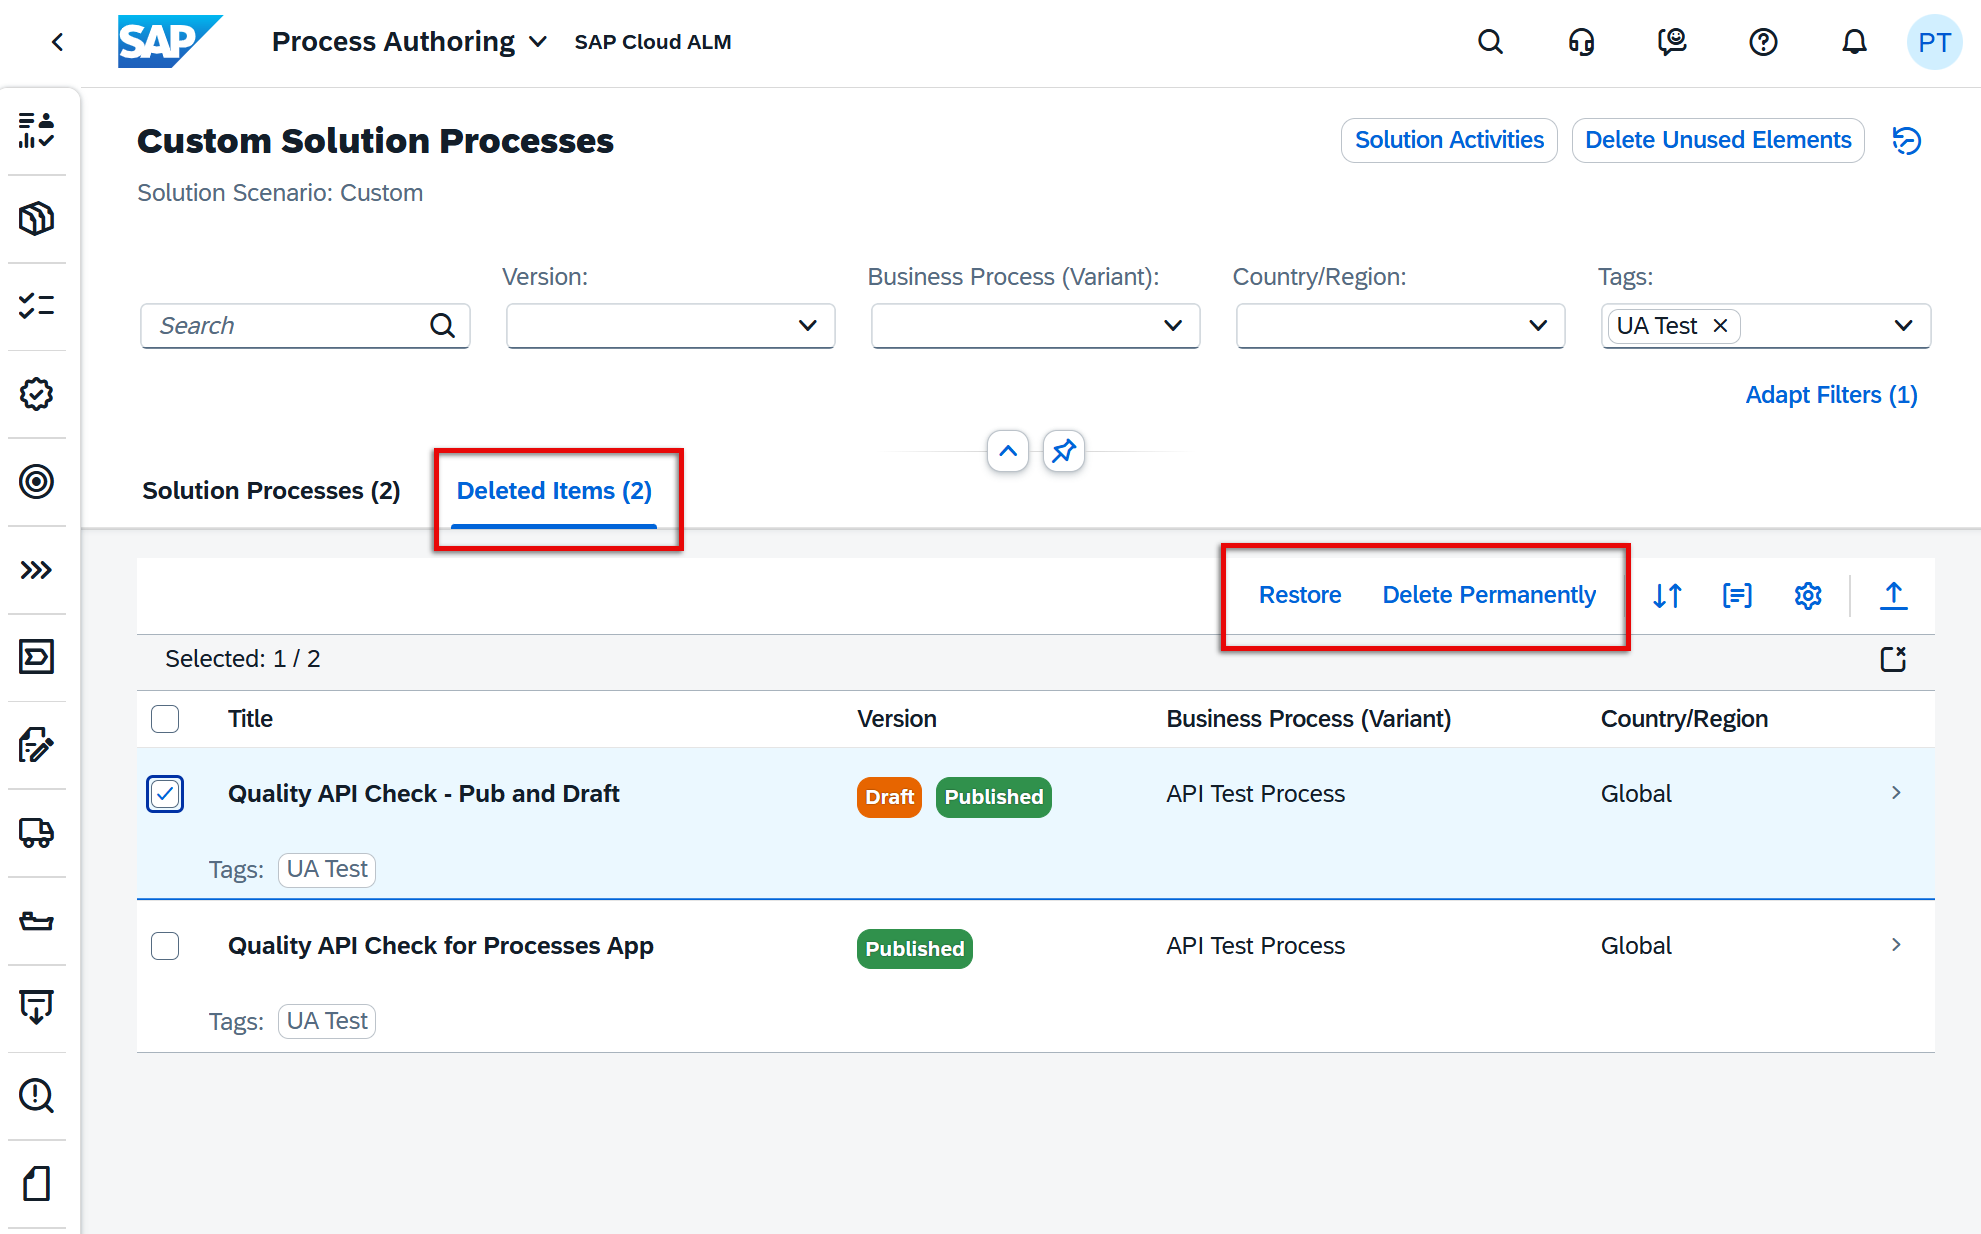
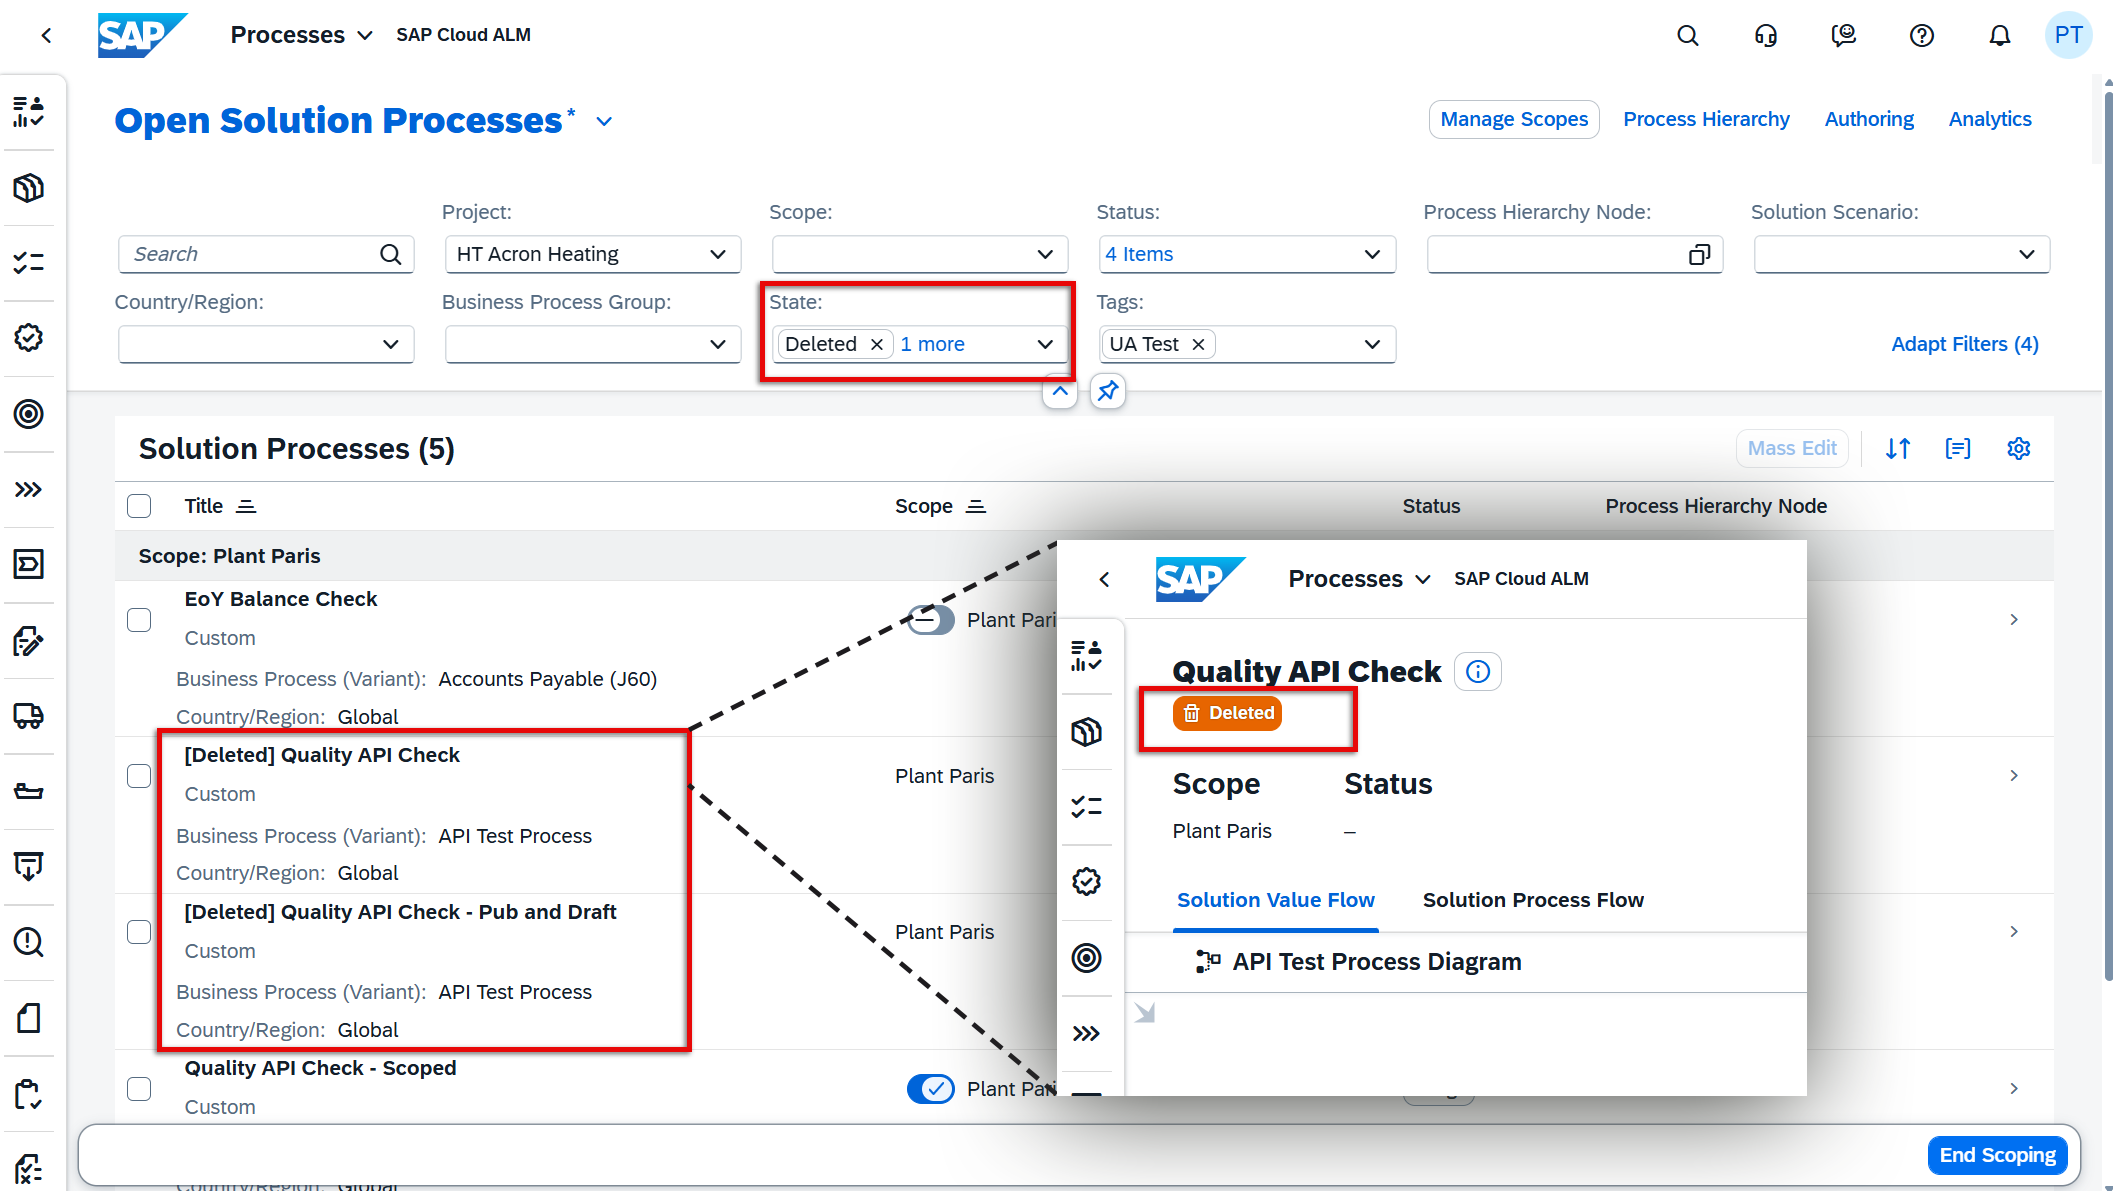
The two-step deletion concept has been enhanced and harmonized for custom solution processes, improving data safety and consistency across SAP Cloud ALM. A new Deleted Items tab is now available, providing a clear overview of deleted solution processes. From there, processes can be restored or permanently deleted, reducing the risk of accidental data loss.
Deletion behavior has been aligned based on process versions:
Processes with published (or both draft and published) versions are moved to Deleted Items
Processes with draft-only versions are deleted permanently immediately
Deleted processes are clearly marked with a [Deleted] prefix and label, and cannot be edited, scoped, or modified unless restored.
This enhancement ensures a safer and more transparent deletion process while maintaining consistency with similar concepts across the platform.
TL;DR:
Custom solution processes now follow a harmonized two-step deletion with a Deleted Items tab, allowing safe deletion, visibility, and easy restoration when needed.
Administration – User Management
Enhanced Connected Identity Provider Card
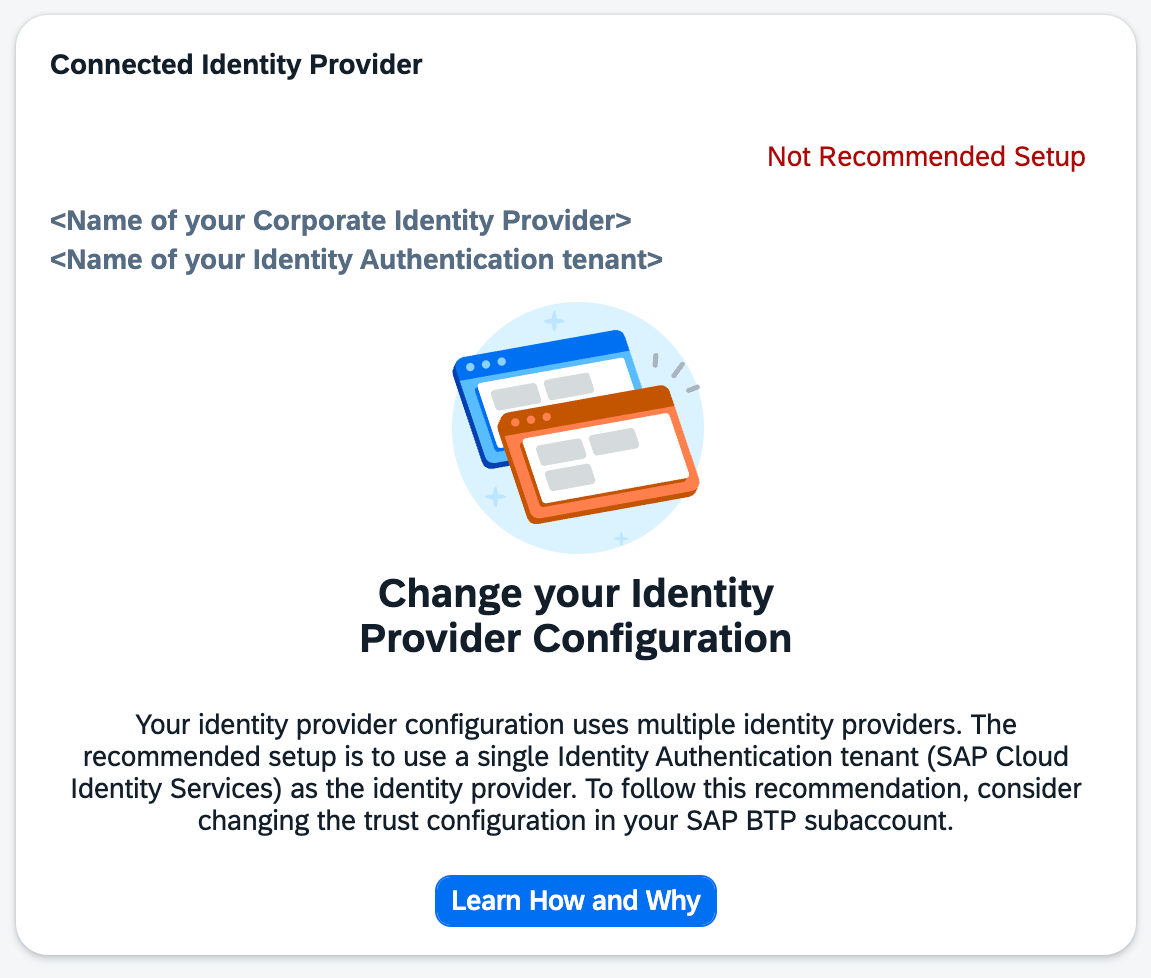
The Connected Identity Provider card in the User Management Overview has been enhanced to provide better visibility into identity configuration status.
The card is now displayed for all customers, regardless of their current identity provider setup. It shows whether the current configuration aligns with recommended SAP Cloud Identity infrastructure standards and highlights if changes are required.
This enhancement helps administrators quickly assess the readiness of their identity setup and take action where needed. Keeping the identity provider configuration aligned with SAP recommendations is essential for enabling upcoming features such as the usage of Joule and ensuring a future-ready setup.
TL;DR:
The Connected Identity Provider card is now available for all customers and indicates whether the identity setup meets SAP recommendations and requires updates.
SAP Cloud ALM continues to evolve with enhancements that improve automation, visibility, and data-driven insights across the platform.
The week 10 release introduces AI-powered innovation analysis in the Service area, enhanced automation and landscape setup in Administration, improved transformation validation and execution reliability in SAP Business Transformation Center, and expanded monitoring and event management capabilities in Operations. The Implementation area also receives updates that increase flexibility and transparency in process management, analytics, and API integrations.
Together, these enhancements simplify system setup, strengthen operational awareness, and provide teams with better tools to manage innovation adoption, transformations, and day-to-day operations across their SAP landscape.
SAP Business Transformation Center – Modeling, Cycle and Monitoring
Updates in the SAP Business Transformation Center focus on improving migration readiness, execution reliability, and overall transparency throughout the transformation lifecycle. The latest enhancements introduce smarter validations in transformation models and improved synchronization and diagnostics during migration cycles, helping ensure smoother and more predictable data transformations.
Validation of Inconsistent Filter Assignments in Modeling
SAP Business Transformation Center introduces an automated validation that improves the reliability of transformation model preparation.
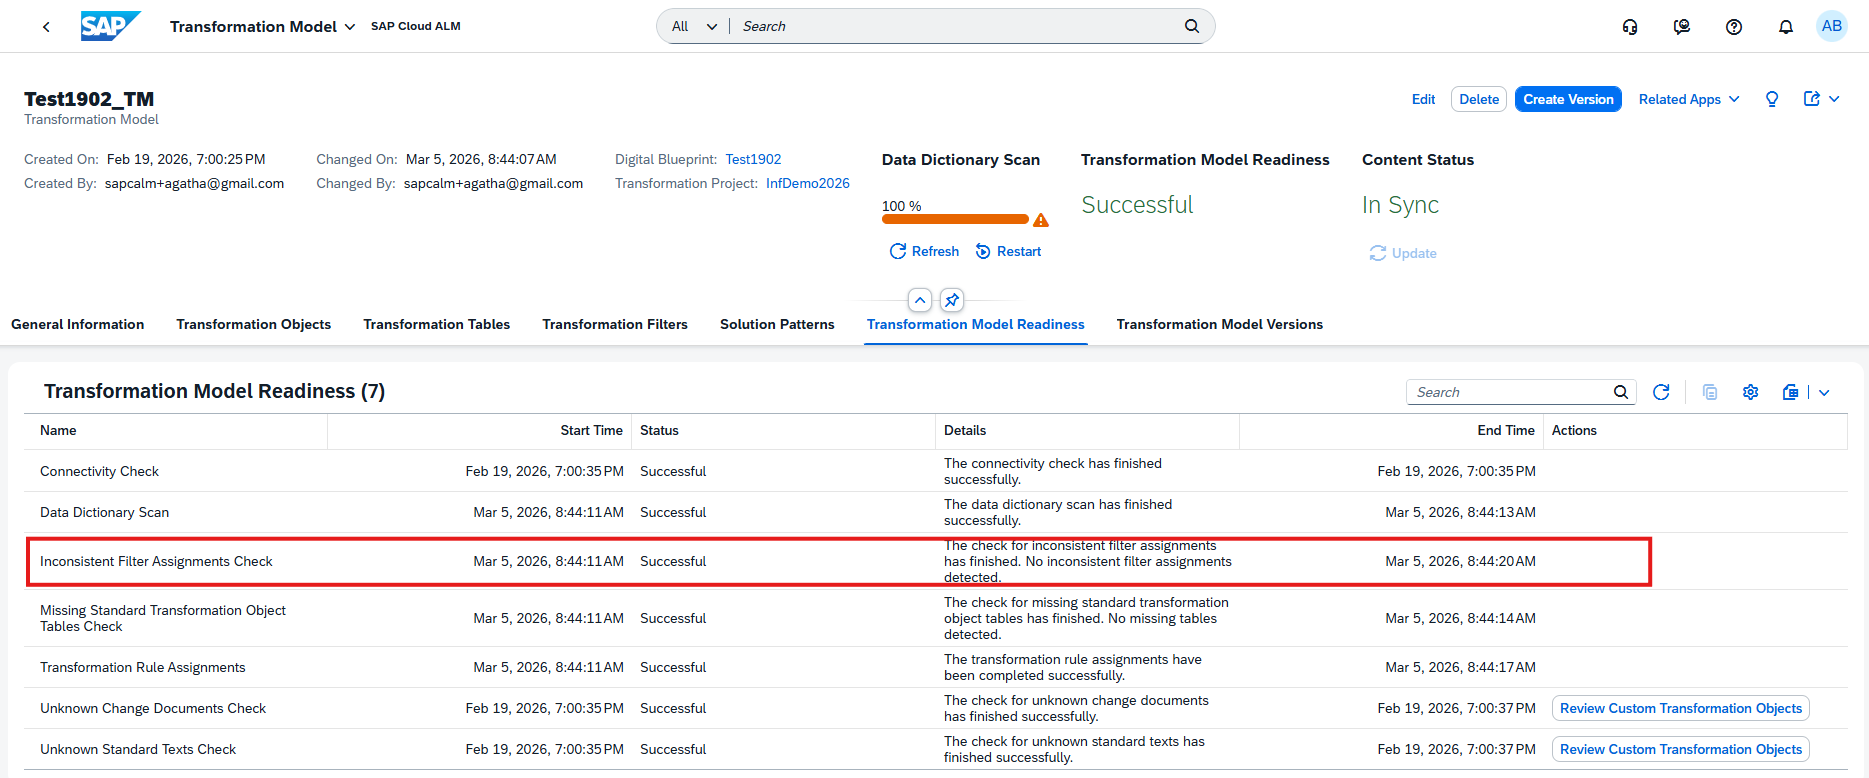
The new Inconsistent Filter Assignments Check automatically identifies filter assignments that reference nonexistent SAP ERP table fields. When such inconsistencies are detected, the system excludes them from the scope of the transformation model version. This prevents potential issues during migration execution while keeping the transformation model version executable.
The check also improves transparency by clearly indicating which filter assignments were removed from the migration scope, helping teams better understand and control the configuration of their transformation models.
The validation is available in the Transformation Model Readiness tab within the Manage Transformation Models app.
TL;DR:
A new Inconsistent Filter Assignments Check automatically detects filter assignments referencing nonexistent table fields and excludes them from the transformation model version to prevent migration issues.
Improved Status Synchronization and Diagnostics in Cycle and Monitoring
Several enhancements have been introduced in the Cycle and Monitoring phase to improve transparency and reliability during migration execution.
Status synchronization has been enhanced so that phase execution states are automatically aligned, ensuring real-time accuracy across the transformation cycle. A new Ready to Restart status has also been introduced, indicating that phases are properly synchronized and prepared for restart operations when needed.
The Health Check capability has been renamed to Run Diagnostics, providing clearer terminology that better reflects its purpose of validating and analyzing the migration landscape.
In addition, the post-processing phase has been improved through a standardized execution mode. The application now uses an optimized uninterrupted execution flow, resulting in a more predictable and stable post-processing experience.
TL;DR:
Cycle and Monitoring improvements introduce synchronized phase statuses with a new Ready to Restart state, rename Health Check to Run Diagnostics, and standardize execution flow to improve post-processing reliability.
Operations – Real User Monitoring, Business Service Management
The Operations area receives updates that improve monitoring clarity and event management. The latest enhancements introduce additional context in Real User Monitoring and better classification and notifications for maintenance events in Business Service Management, helping operations teams stay informed and respond more effectively to system activities.
Add a custom description to a request name
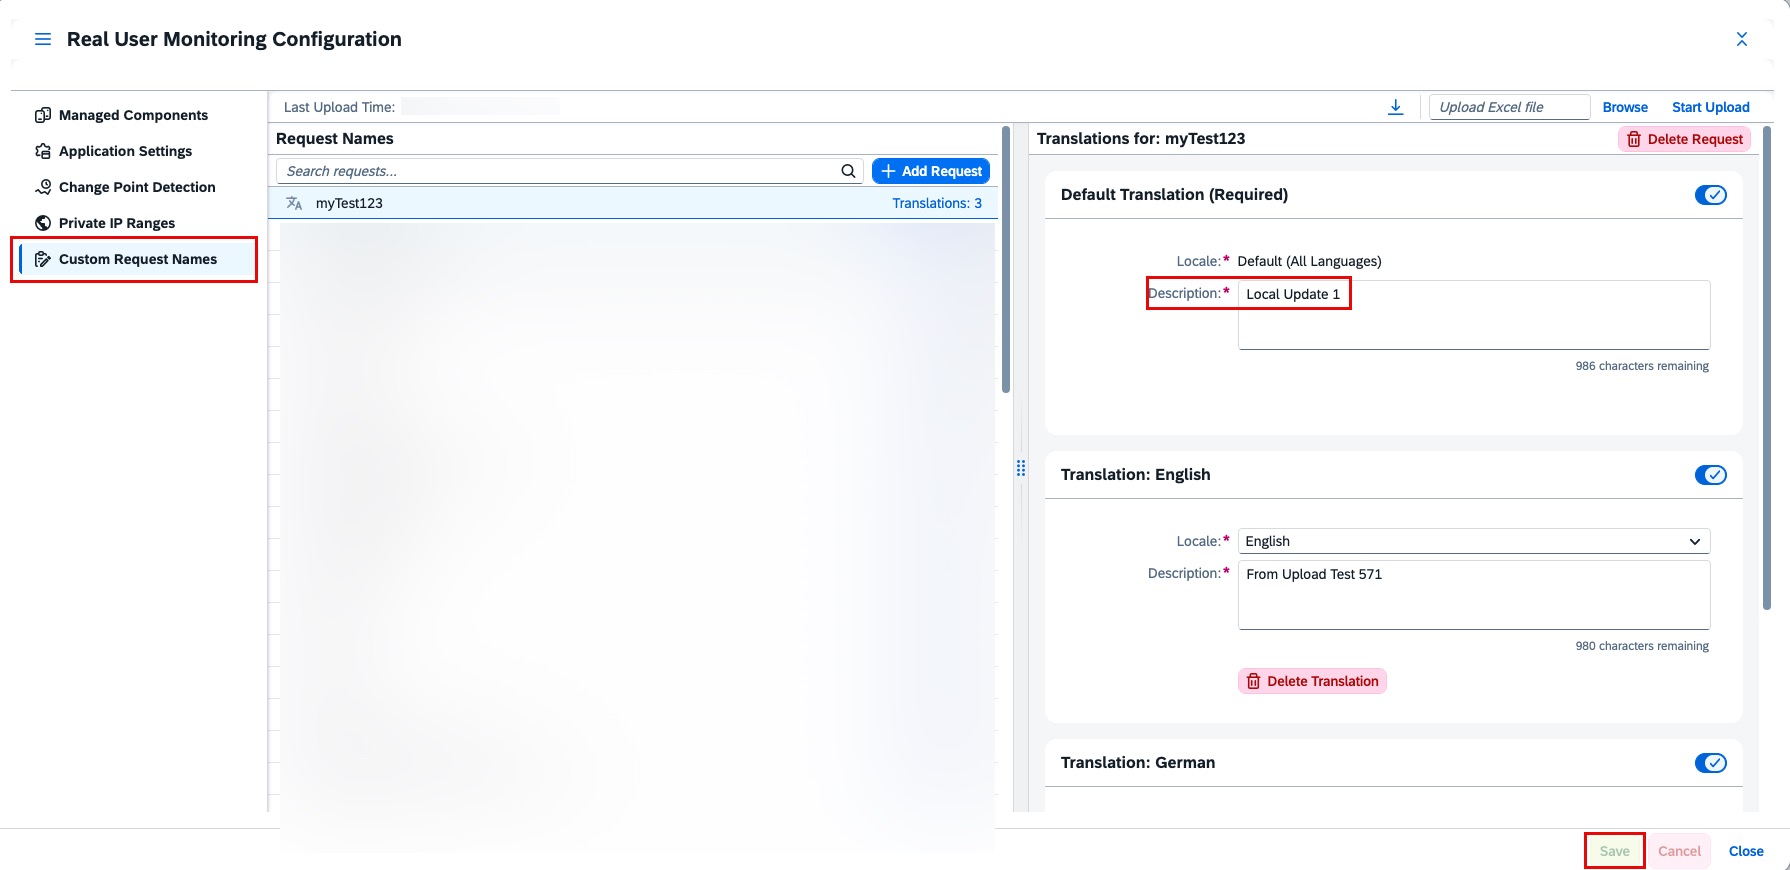
In Real User Monitoring, it is now possible to add a custom description to request names in the Configuration screen. This enhancement helps provide additional context and improves clarity when analyzing monitored requests.
A description can be added by selecting a request name in the configuration view, entering the desired description, and saving the changes.
The description then becomes visible alongside the request, making it easier to understand the purpose or business context of specific requests during monitoring and analysis.
Keep in mind that custom descriptions can only be added by the Real User Analyst Administrator role.
TL;DR:
Custom descriptions can now be added to request names in Real User Monitoring, improving clarity and context when analyzing monitored requests.
New event category Maintenance Type and Reminders for Maintenance event
A new Maintenance Type event category is now available for maintenance events related to public cloud offerings in Business Service Management. This additional classification helps distinguish different kinds of maintenance activities and provides clearer context when reviewing events. The Maintenance Type can be viewed in the Event Details screen on the Event Calendar page and in the Type column of the Events table in Service Level Reporting.
In addition, maintenance event reminders are now recorded in the Action Log. Based on the configured event actions, notifications are triggered before and during maintenance windows for events created by SAP. These reminders help operations teams stay informed about upcoming or ongoing maintenance activities, ensuring better preparation and response during scheduled service events.
Together, these enhancements improve operational awareness and make it easier to track, categorize, and react to maintenance activities affecting cloud services.
TL;DR:
Maintenance events can now be categorized with a new Maintenance Type, and reminders are logged in the Action Log, improving visibility and readiness for scheduled maintenance activities.
Implementation – Processes, Process Authoring, Documents, Analytics
The Implementation area introduces enhancements that improve transparency, flexibility, and integration across project execution activities. The latest updates bring more granular process scoping, better traceability in process management, extended APIs for document integrations, and new analytical capabilities for risk evaluation – helping project teams manage implementation work with greater control and insight.
Granular Process Scoping and Change History in Processes
Processes in the Implementation area becomes more flexible and transparent with new capabilities for detailed scoping and change tracking.
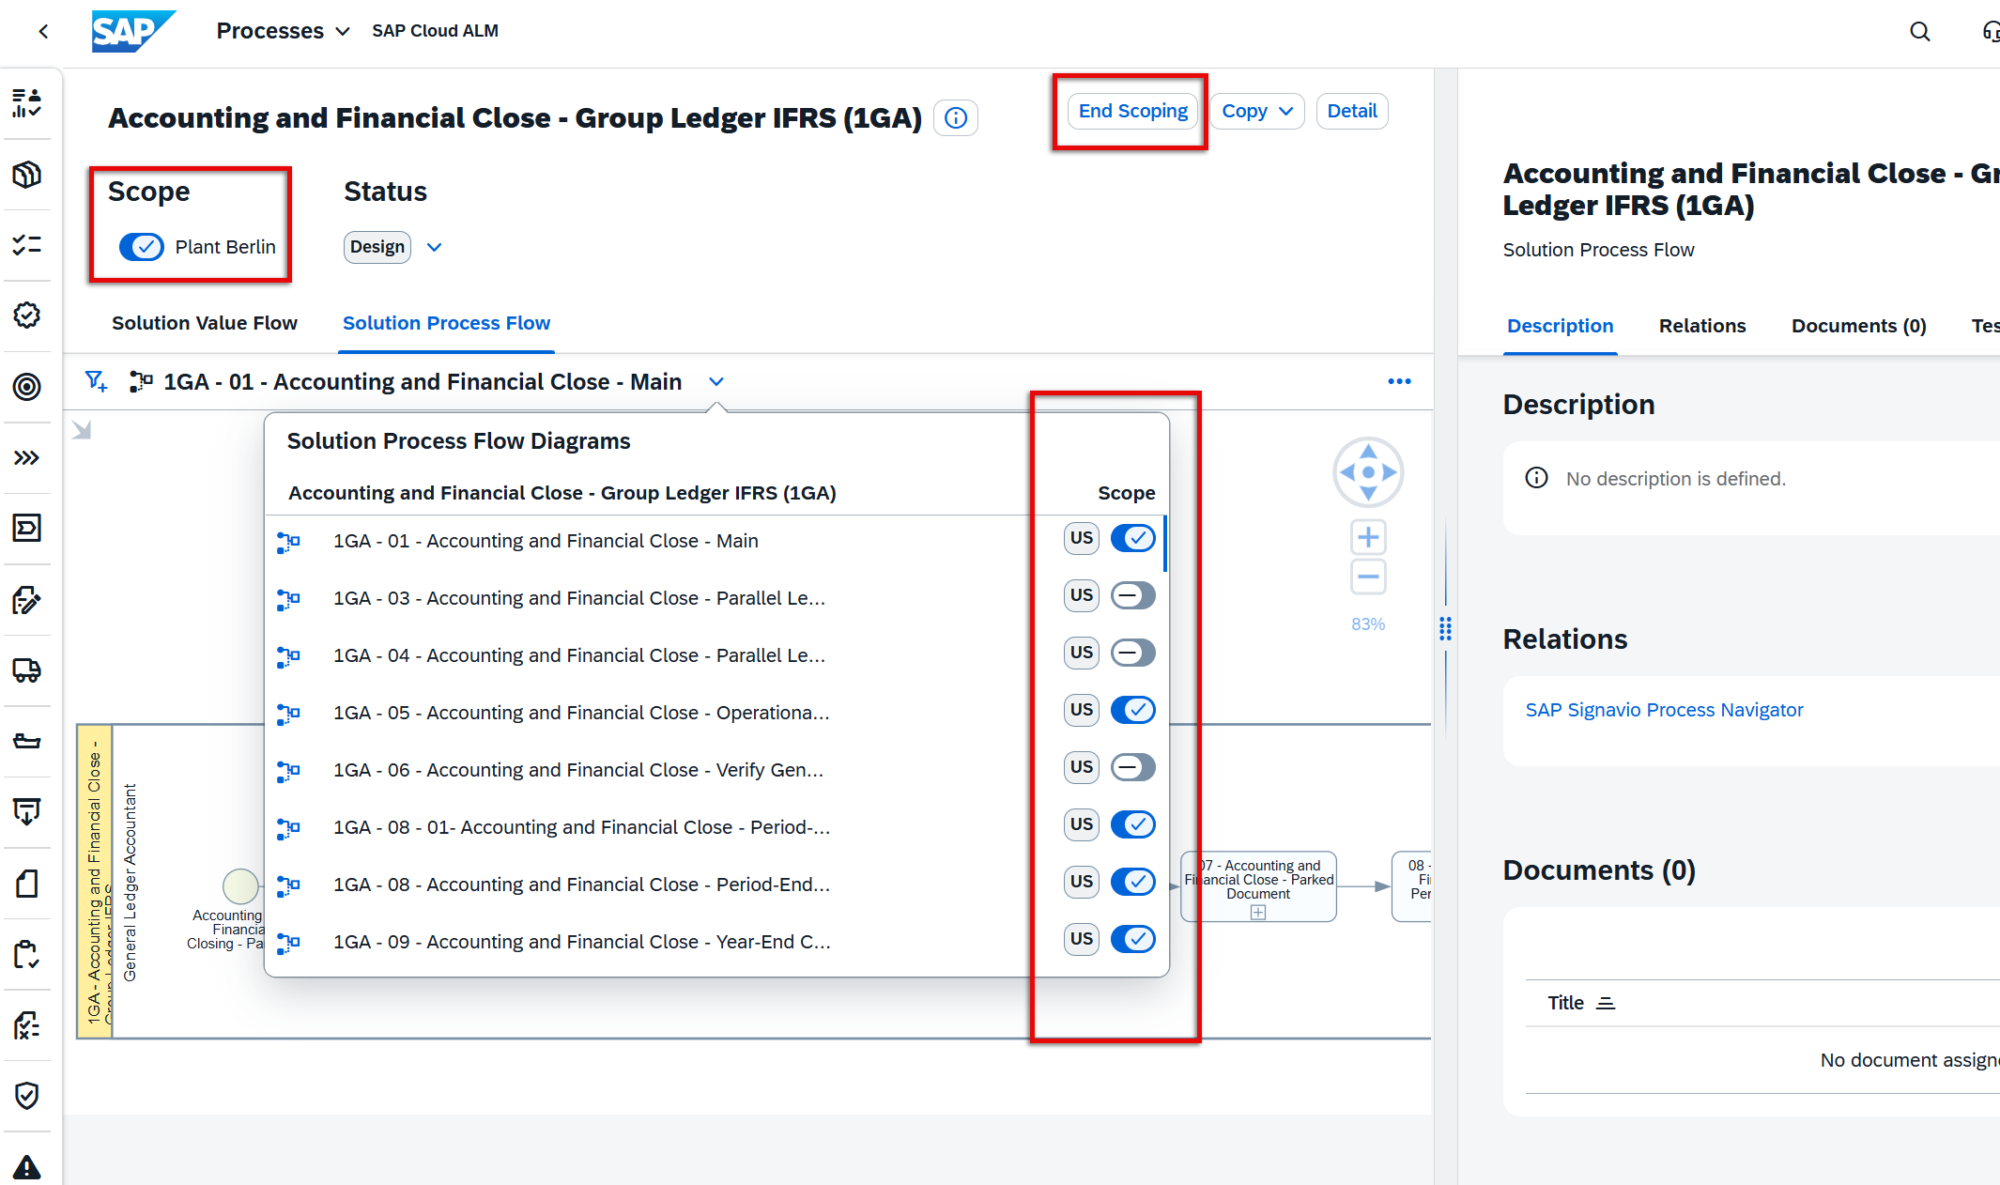
Projects can now scope individual solution process flow diagrams instead of scoping entire solution processes. This allows teams to focus only on the diagrams relevant to their implementation. The enhancement is particularly useful for large end-to-end scenarios such as Lead to Cash or Recruit to Retire, where multiple diagrams may exist due to localization or scenario variations. The previous process-level scoping method remains supported, while the new option provides more granular control over the implementation scope.
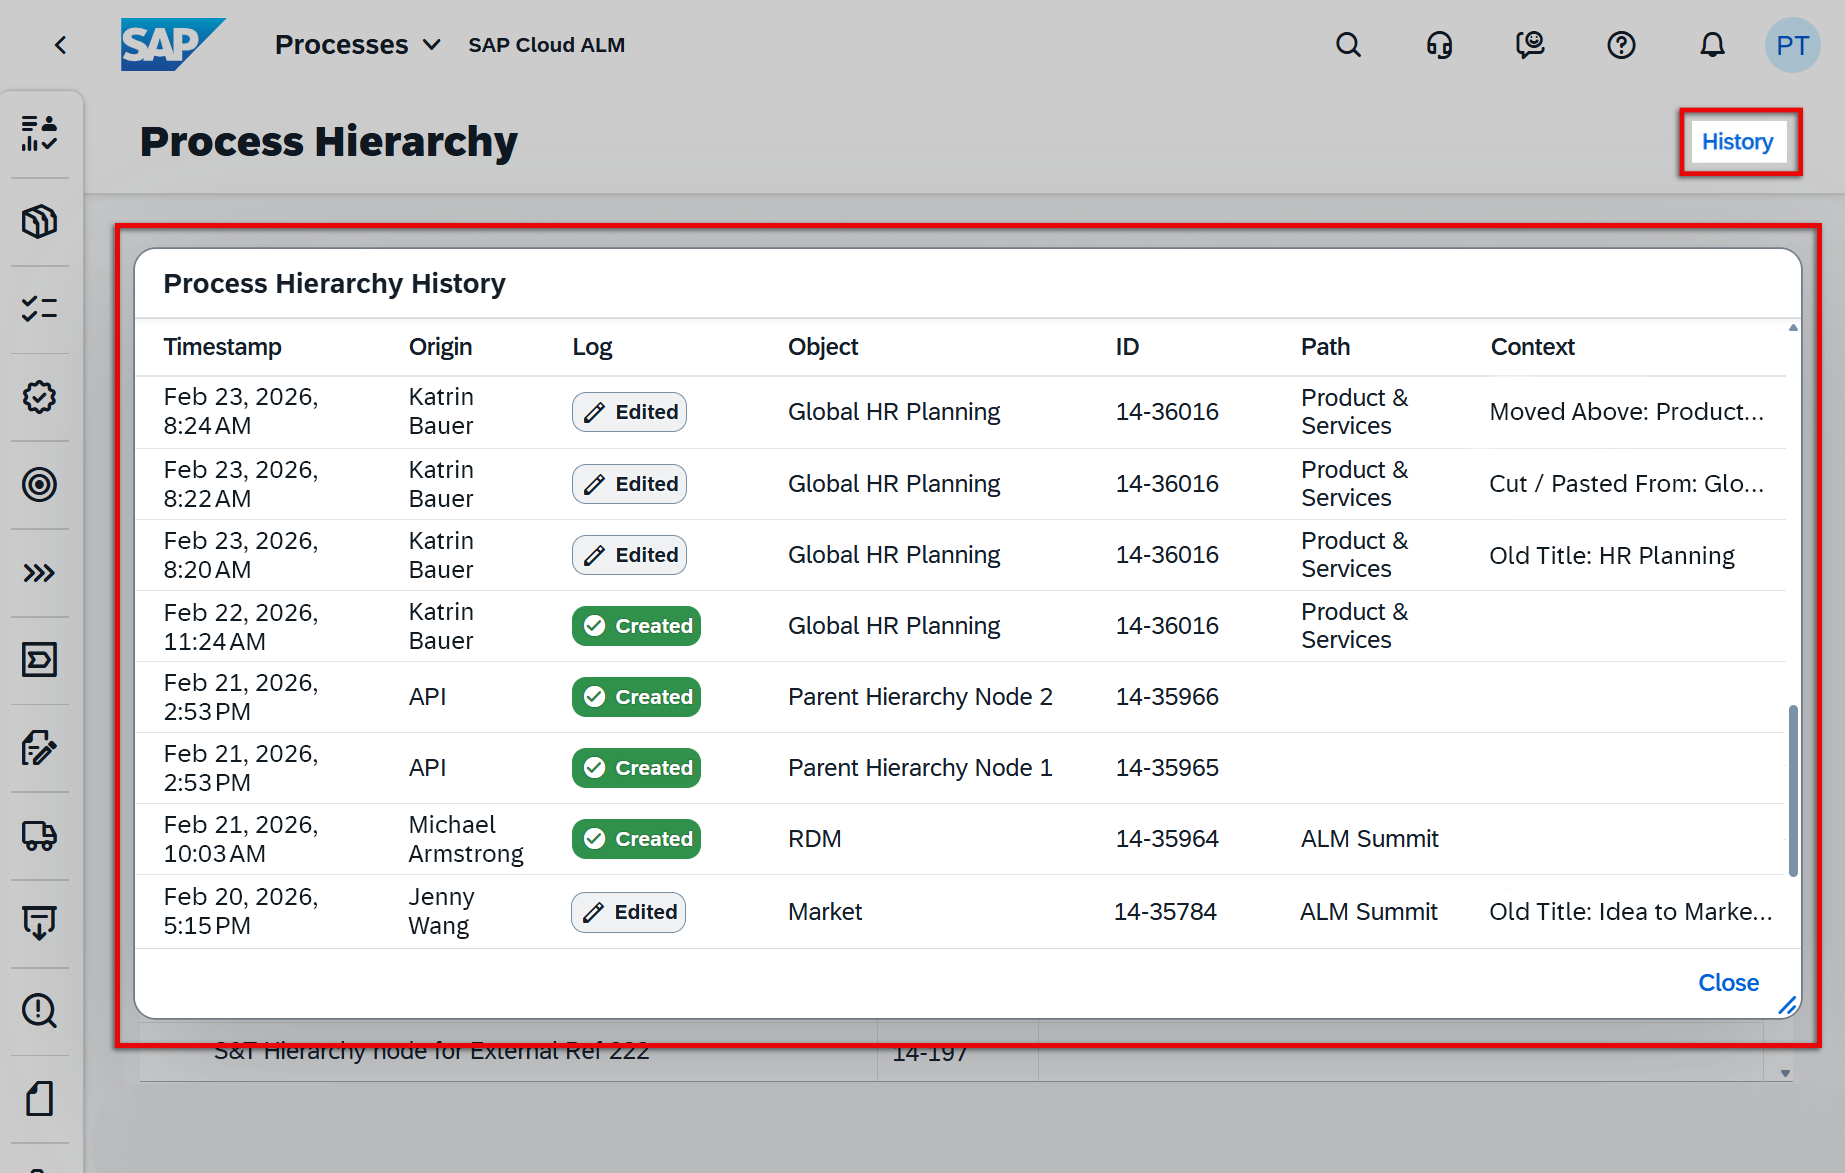
In addition, the Process Hierarchy app now includes a history function that records changes made to process hierarchy nodes. The history shows when a change occurred, what was modified, and who performed the change (unless executed via API). Changes made through the UI, public APIs, or spreadsheet uploads are all tracked, improving traceability and governance of process structure updates.
TL;DR:
Solution process flow diagrams can now be scoped individually for more precise implementation scoping, and the Process Hierarchy app introduces a change history to track modifications across the process structure.
Display External References for Process Diagrams in Process Authoring
Process Authoring now provides improved visibility of external references linked to solution process flow diagrams.
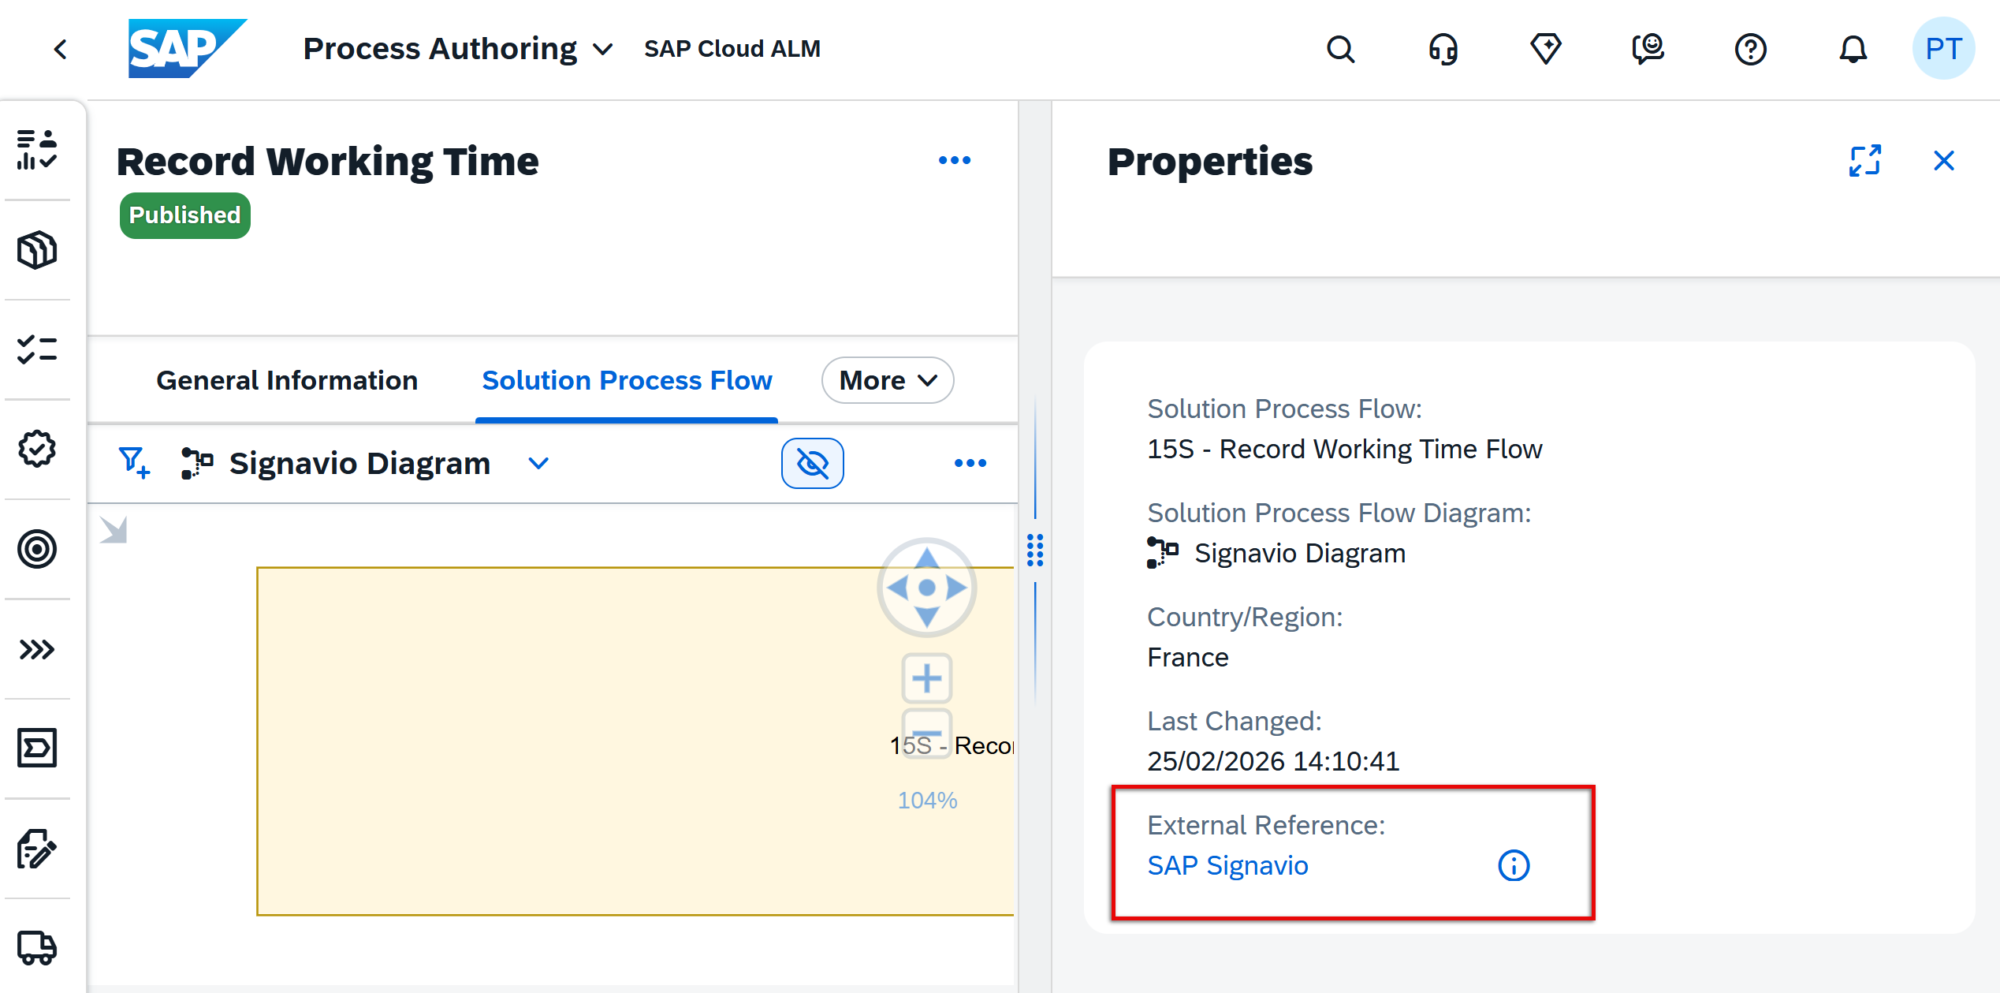
If a diagram contains an external reference, it is now displayed in the Properties section when the diagram is selected in Process Authoring. The external reference name appears as an active link, enabling direct navigation to the referenced source.
Additional context is available by hovering over the information icon, which reveals the ID of the external reference. If the section is not visible, it indicates that no external reference has been assigned to the selected diagram.
This enhancement helps users better understand diagram origins and quickly access related external content when working with process models.
TL;DR:
External references for solution process flow diagrams are now visible in Process Authoring, with direct navigation links and reference ID details for improved traceability.
Extended Documents API
The Documents API has been extended with additional fields to improve document integration and management capabilities.
The API now exposes the following fields: ownerId, responsibleId, approvalCode, stateCode, and isTemplate. These fields are available for read operations, allowing integrations to retrieve more detailed information about document ownership, responsibility, approval status, and template usage.
Depending on the applicable business logic, some of these fields can also be provided during create operations, enabling more flexible automation and integration scenarios.
TL;DR:
The Documents API now includes additional fields such as owner, responsible, approval, and state information, improving integration and automation options for document management.
New Risk Analysis App Released in Analytics
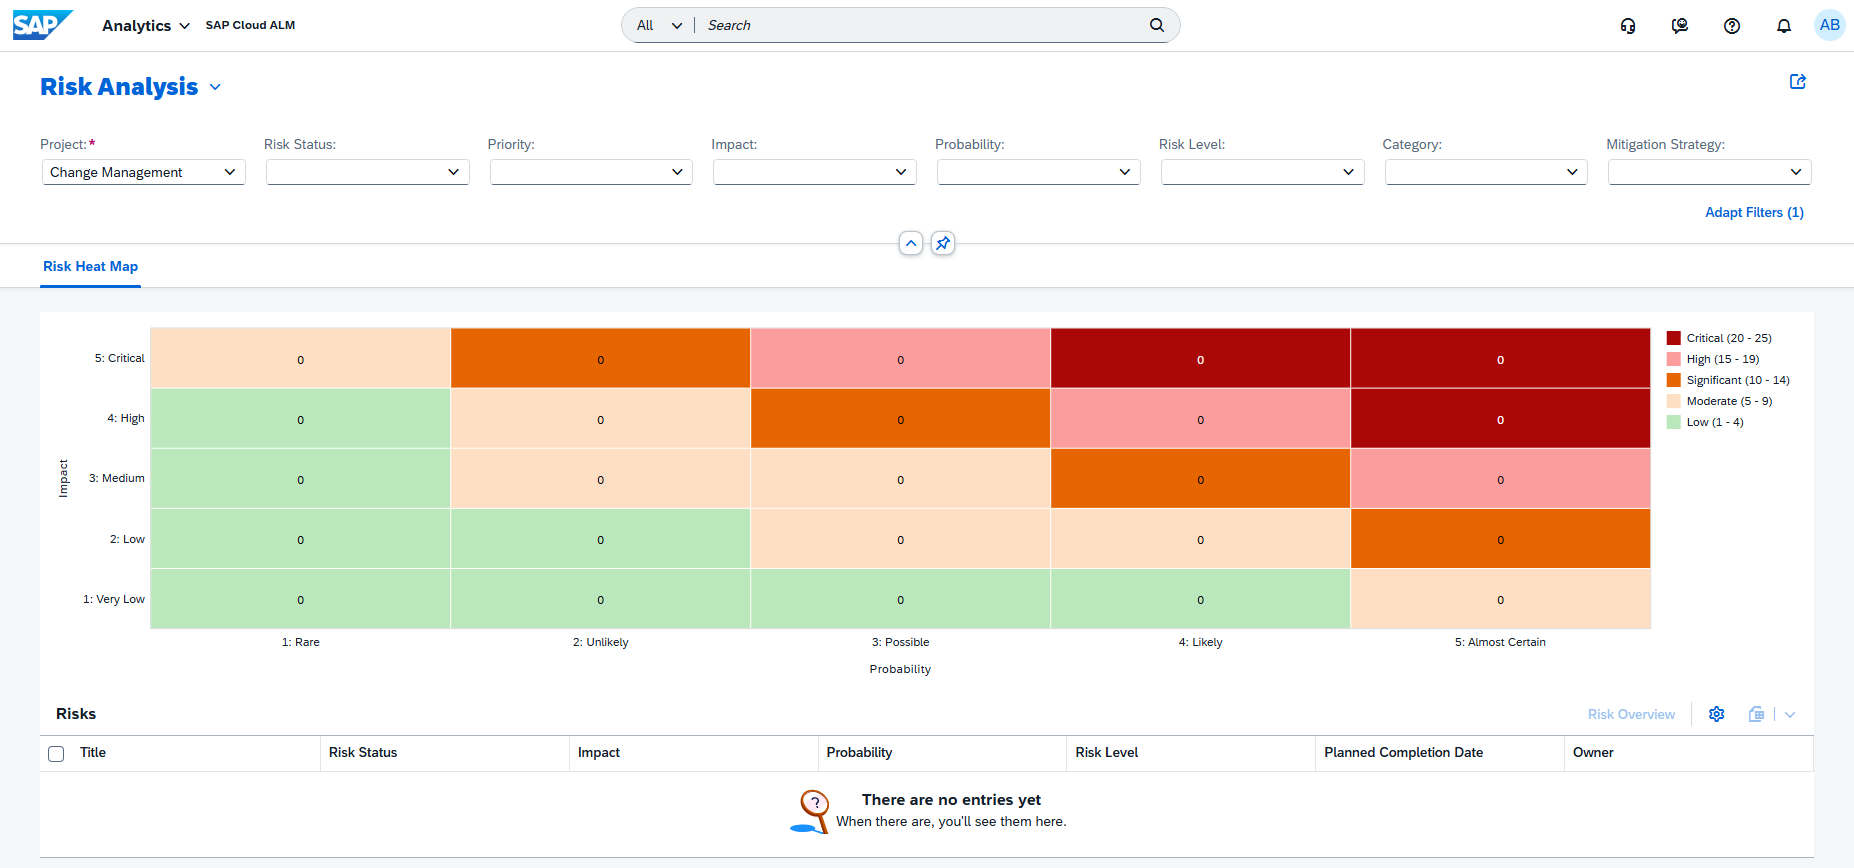
A new Risk Analysis app is now available, providing a visual and analytical overview of project risks to support better prioritization and decision-making.
The app uses a heatmap visualization that plots risks by impact (Y-axis) and probability (X-axis). Each cell is color-coded and includes a calculated score, making it easy to identify risk hotspots and areas that require immediate attention. This allows project teams to quickly assess where risks are concentrated and focus mitigation efforts accordingly.
Users can refine the analysis using filters such as Project, Status, Risk Category, Risk Level, or Date Range, and easily drill down from the heatmap to detailed risk lists and full risk records. Views can also be customized by adjusting chart dimensions, sorting, and grouping.
To streamline analysis, users can save personalized views with selected filters and chart settings. These views can later be reused, managed, or – if permissions allow – shared with other users as public views, enabling consistent risk analysis across teams.
TL;DR:
The new Risk Analysis app introduces a heatmap-based visualization of project risks, helping teams identify risk hotspots, prioritize mitigation actions, and analyze risks through customizable and shareable views.
Administration – Landscape Management
S/4HANA Cloud Setup Automation
Setting up monitoring connectivity between SAP S/4HANA Cloud and SAP Cloud ALM previously required several manual configuration steps. Administrators had to create communication systems, configure OAuth authentication, and maintain multiple communication arrangements for monitoring scenarios such as Application Monitoring and Business Process Monitoring.
With the new S/4HANA Cloud Setup Automation feature in Landscape Management, these steps are now handled automatically through Unified Customer Landscape (UCL).
Once triggered, the automation performs the required configuration tasks in the background, including:
Creating the required communication systems
Managing and configuring communication arrangements
Activating all supported monitoring use cases
Establishing the secure connectivity between SAP S/4HANA Cloud and SAP Cloud ALM
By eliminating the need for manual configuration across multiple applications and settings, this enhancement significantly reduces setup complexity and time, while ensuring a consistent and error-free monitoring setup.
This improvement enhances the onboarding experience for S/4HANA Cloud systems and simplifies the activation of monitoring capabilities within SAP Cloud ALM.
TL;DR:
S/4HANA Cloud systems can now be onboarded automatically using UCL, streamlining connectivity setup and activating monitoring use cases with minimal manual effort.
Service – AI Assistance for Innovation Adoption
New App AI Assistance for Innovation Adoption
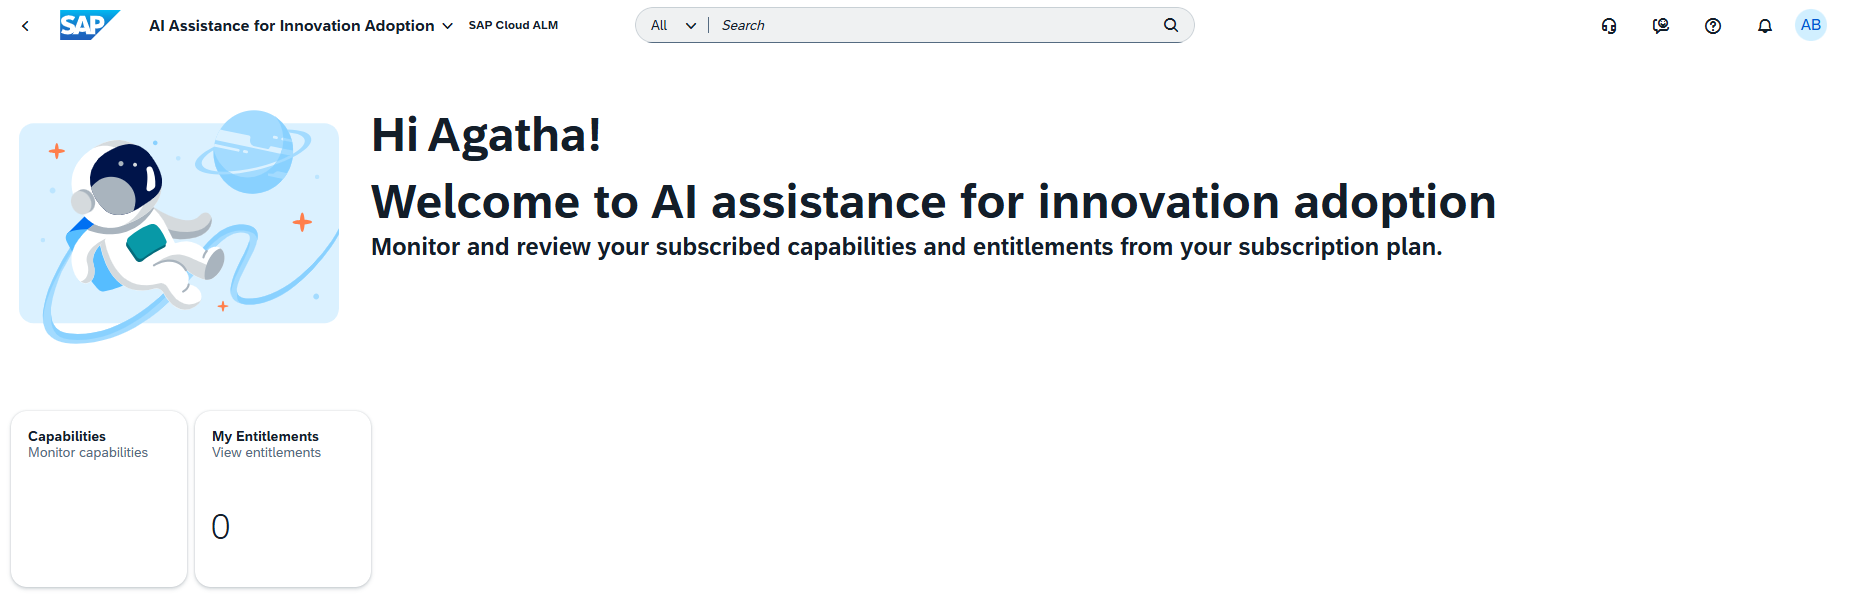
A new application, AI Assistance for Innovation Adoption, is now available in the Service area of SAP Cloud ALM. The app helps organizations monitor, analyze, and improve their SAP landscape using AI-driven insights, providing a data-driven approach to innovation adoption and system optimization.
The application collects and analyzes system data and presents the results through interactive dashboards with predefined KPIs. These dashboards highlight the health and performance of different areas of the SAP landscape. When a KPI falls outside its expected range, the app can automatically create issues and recommend actions, helping teams quickly identify improvement opportunities.
The analysis is structured around capabilities, which represent specific focus areas of the SAP landscape. Each capability includes a dedicated dashboard that visualizes system health and performance and supports deeper investigation of identified issues. Currently available capabilities include:
Adoption potential for RISE with SAP
Data capacity excellence
Enduring cybersecurity
Evolution readiness
Extensibility intelligence
Operational excellence of SAP BTP
When the app identifies potential issues, they are automatically created in Issues and Actions Management, where teams can review them and convert them into tasks or projects to manage follow-up activities directly within SAP Cloud ALM.
The app also includes a My Entitlements section, which provides visibility into the services and capabilities available according to the organization’s contract or subscription. This allows teams to quickly verify which innovation capabilities can be analyzed and monitored within the application.
Capabilities are configured using a reference identifier depending on the focus area being analyzed:
Customer number – used for the Operational Excellence capability of SAP BTP
System number – used for all other capabilities
This ensures that the analysis is correctly linked to the relevant systems or landscape context.
Overall, the application supports a continuous improvement cycle – collecting data, analyzing results, visualizing insights through dashboards, and enabling follow-up actions – helping organizations continuously improve their SAP landscape and adopt innovations more effectively.
TL;DR:
The new AI Assistance for Innovation Adoption app uses AI-powered dashboards and KPIs to analyze SAP landscape health, highlight improvement opportunities, and generate actionable issues and tasks to support continuous innovation adoption.
SAP Cloud ALM continues to evolve with focused enhancements that deepen visibility and strengthen operational control.
The week 8 release brings expanded scoring and analytics in RISE with SAP Methodology, smarter readiness and data quality capabilities in SAP Business Transformation Center, and broader monitoring coverage and configuration transparency in Operations.
Together, these updates enhance insight, improve governance, and help teams manage transformation and operations with greater clarity and confidence.
SAP Business Transformation Center Transition, Scoping, Modeling, Data Management
The latest updates in SAP Business Transformation Center focus on strengthening transformation readiness, improving data quality transparency, and increasing automation across scoping, modeling, and data management. With enhanced system scans, smarter validation checks, and deeper analytical insights, teams can execute SAP ERP cloud transformations with greater confidence, control, and reduced manual effort.
Improvements in the Transformation Project Overview app
The Transformation Project Overview app has been enhanced to provide better visibility and control across all transformation phases.
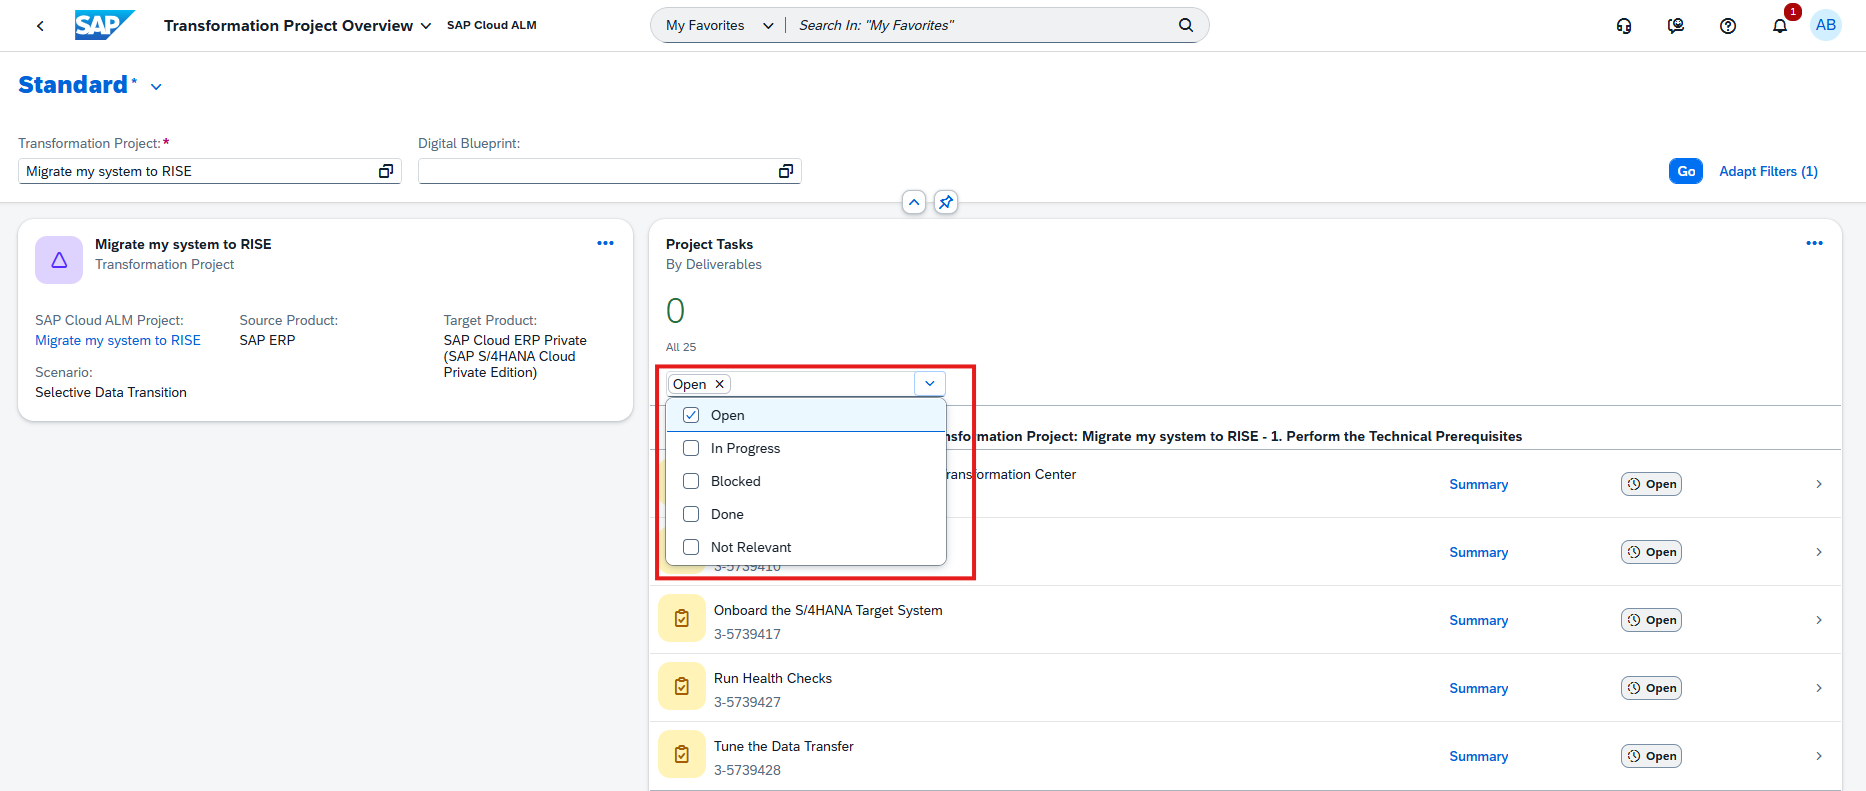
The list of available tasks has been refined, and tasks can now be filtered by status, making it easier to focus on open or critical activities.
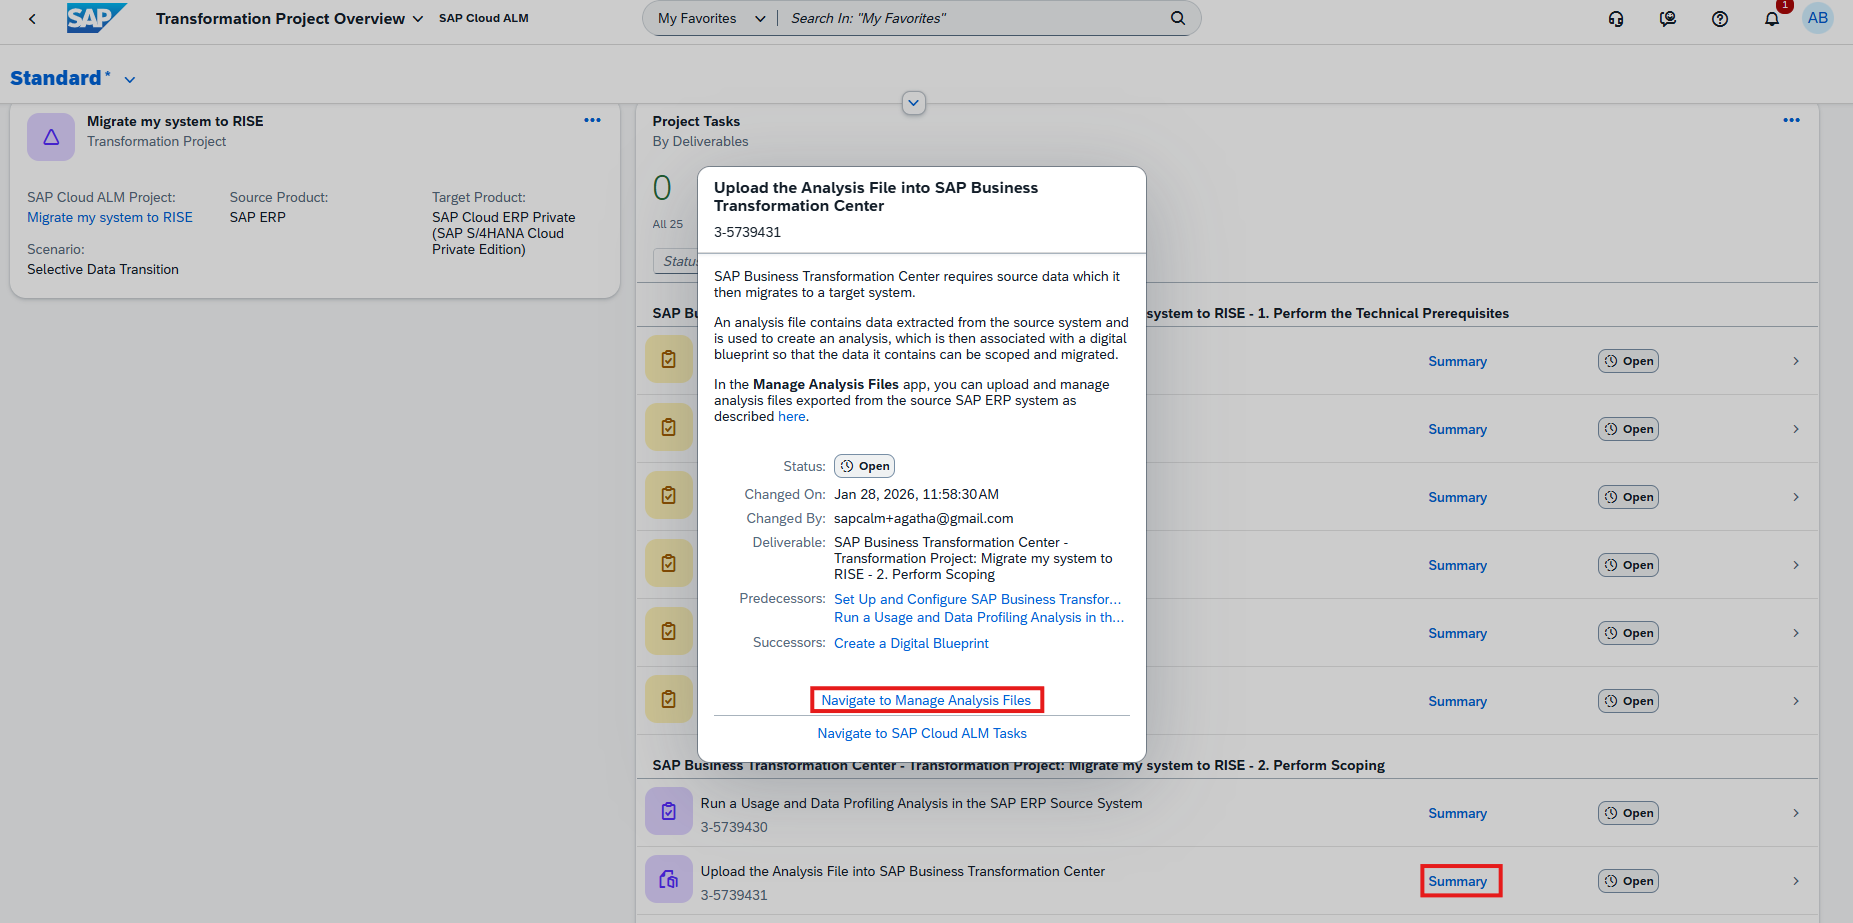
In addition, tasks related to Scoping, Modeling, and Cycle & Monitoring can now be tracked directly within the overview, including their execution progress and current status.
Each relevant task also includes direct navigation links to the corresponding apps, enabling seamless transitions between the Transformation Project Overview and the Scoping, Modeling, or Cycle & Monitoring apps.
These improvements strengthen transparency, simplify navigation, and help teams manage transformation progress more efficiently from a central view.
TL;DR:
The Transformation Project Overview app now offers refined task lists, status filtering, phase tracking, and direct navigation to related apps for better end-to-end project visibility.
Enhanced Filter Assignments for Organizational Units and Time Slices in Scoping
Scoping capabilities have been extended to improve precision during system scans and data selection.
Filter assignments for organizational unit–related table fields now include the Financial Management Area domain (FIKRS). This ensures that relevant financial management structures are properly considered during scoping and migration preparation.
In addition, the system scan can now detect time-slice–relevant domains, specifically GJAHR (fiscal year), in custom database tables. Based on this detection, time slice filter assignments are automatically derived, enabling data migration according to the selected fiscal year.
When the time slice solution pattern is activated, the fiscal year filter is automatically enabled for one relevant field in the custom table. The filter can still be adjusted or deactivated in the Select Scanned Tables app if required.
These enhancements provide more granular scoping, better alignment with financial structures, and improved control over time-dependent data migration.
TL;DR:
Scoping now supports FIKRS-based filters for organizational units and automatically derives fiscal year (GJAHR) time-slice filters for custom tables, enabling more precise and flexible data migration.
Automatic Detection of Missing Standard Transformation Object Tables in Modeling
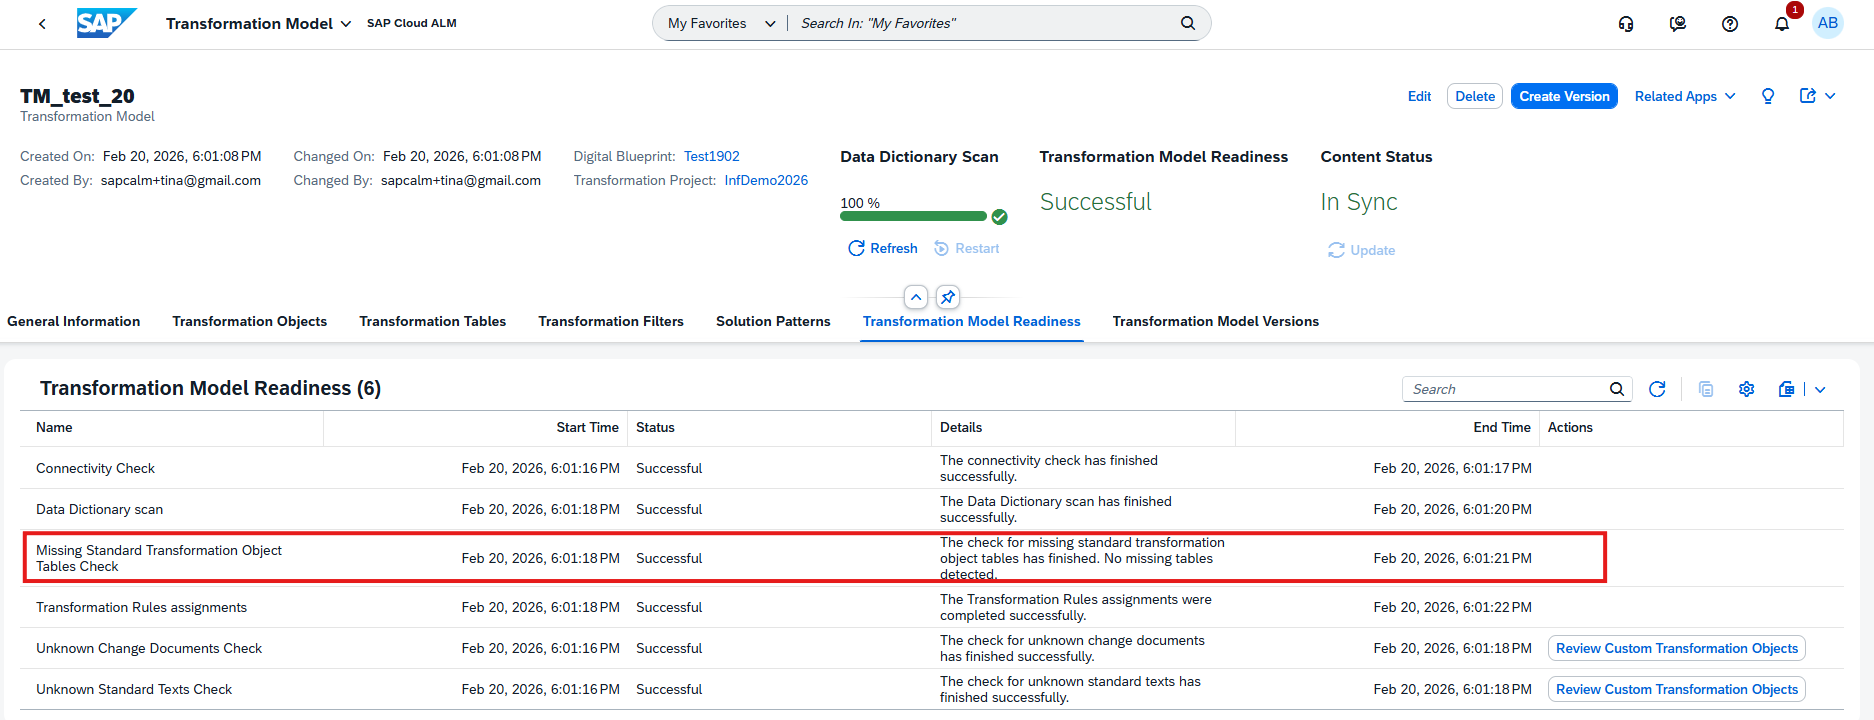
Modeling is further improved with automatic detection and handling of missing standard transformation object tables. If tables that belong to a standard transformation object are not present in the SAP ERP source system, they are now automatically identified and excluded from the transformation model version. This also applies to related child tables, object relations, rules, and filter assignments.
By automatically removing non-existing elements from the model, the system helps reduce potential errors and strengthens overall data integrity during transformation.
This functionality is managed through the new Missing Standard Transformation Object Tables Check, available in the Manage Transformation Models app as part of the Transformation Model Readiness checks.
TL;DR:
Missing standard transformation tables are now detected and automatically excluded from model versions, reducing errors and improving transformation reliability.
Trend Analysis and Improved Cross-App Navigation in Data Management
Data quality monitoring becomes more transparent and connected with two key enhancements in Data Management.
In the Analyze Data Quality app, a new trend chart is now available on the KPI Detail Page. It visualizes how the total number of errors for a selected KPI evolves across multiple successfully completed Quality Check Runs. This makes it easier to identify improvement or deterioration trends and base decisions on historical KPI development.
In addition, navigation between apps has been streamlined. From the Manage Runs app, it is now possible to jump directly from the Run Object Page to the corresponding KPI Object Page for deeper analysis. When creating a new run or viewing an existing one, the system also displays the required ST-PI version, ensuring that all technical prerequisites for execution are clearly visible.
TL;DR:
New KPI trend charts enable historical data quality analysis, while improved navigation and ST-PI version visibility simplify technical validation and cross-app analysis.
RISE with SAP Methodology – Operations View
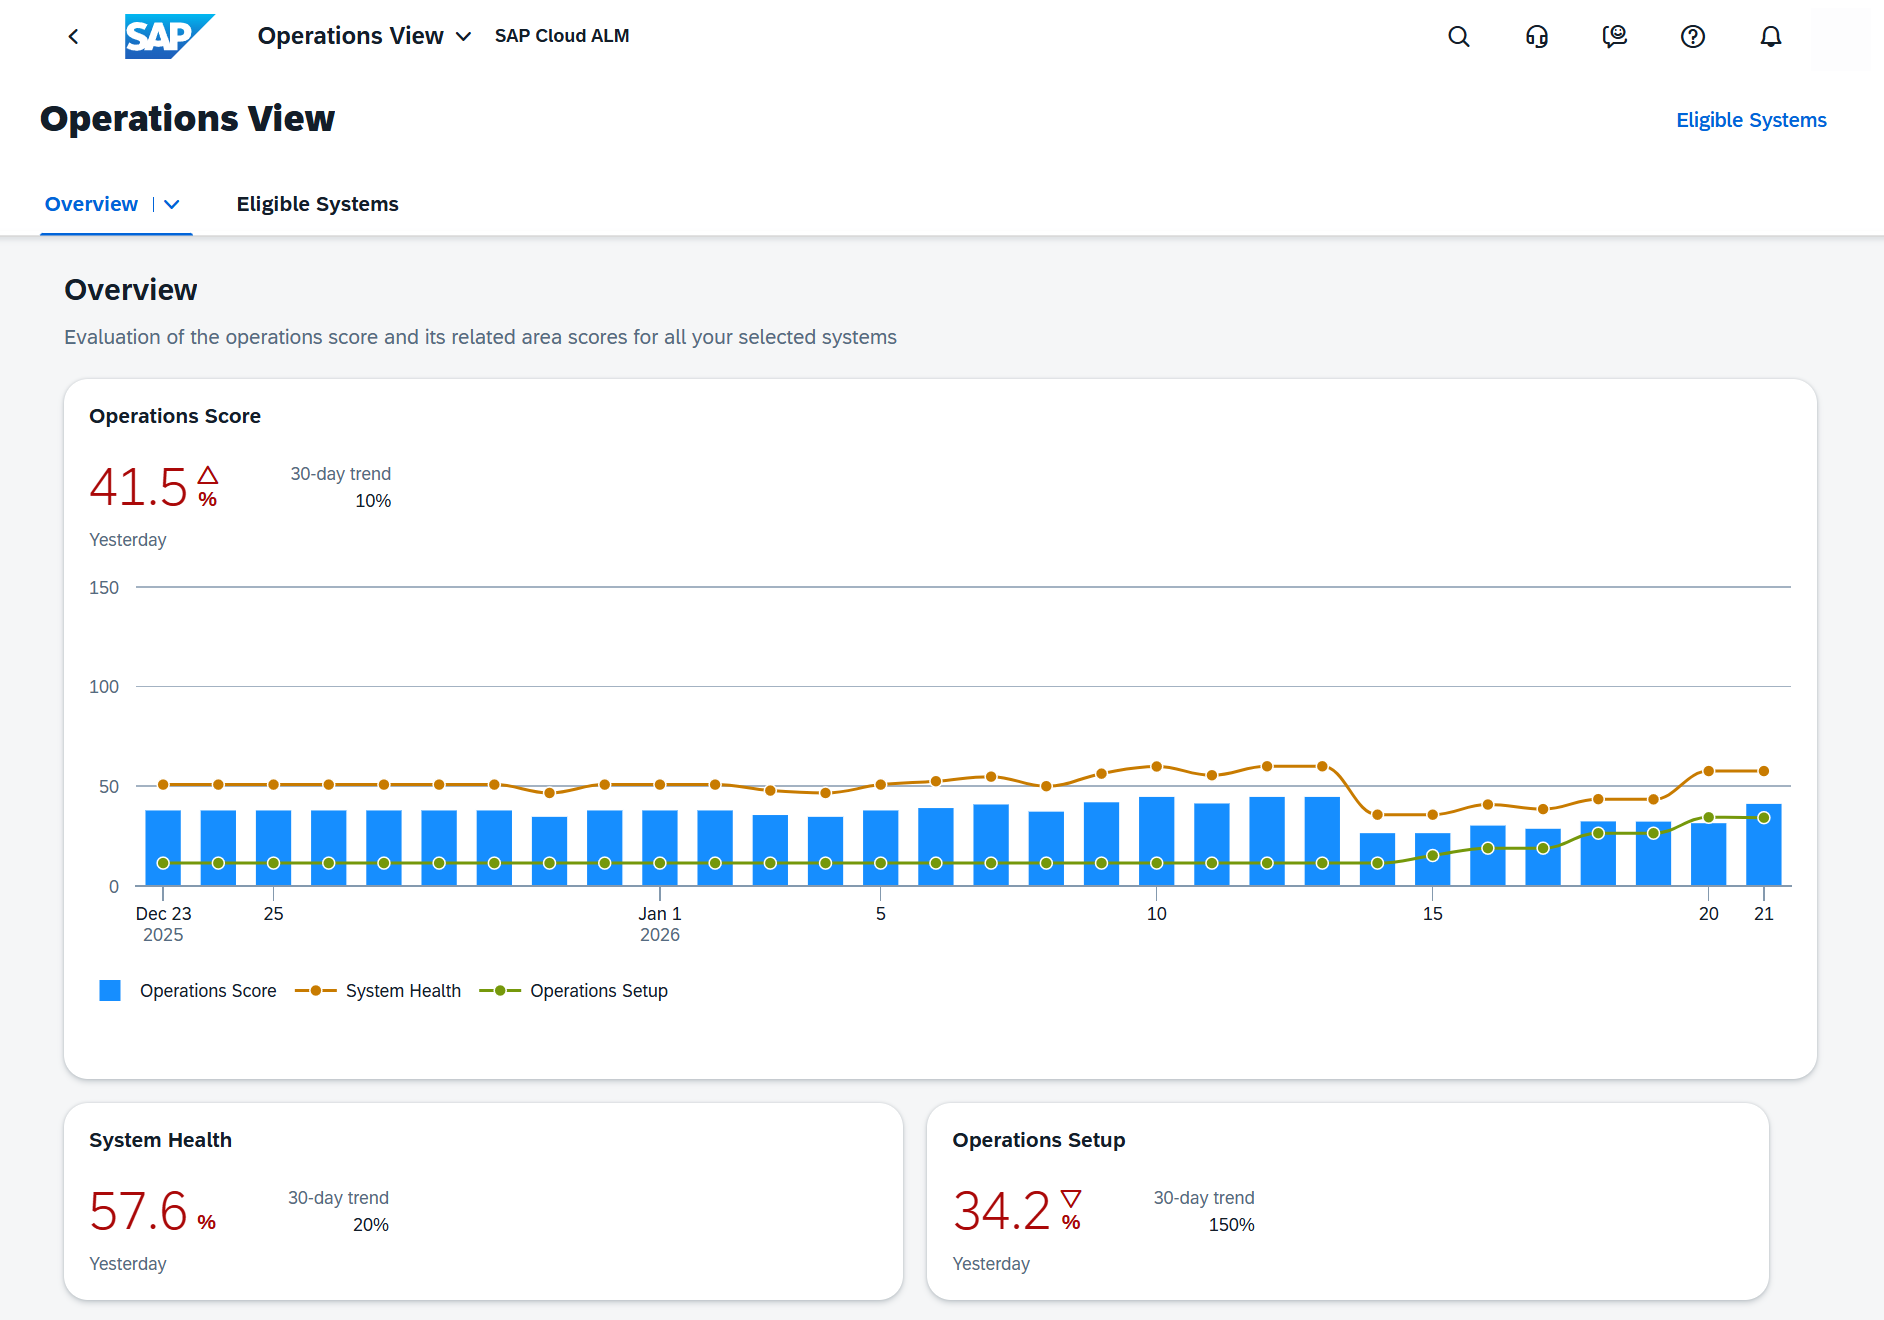
New Operations Scores
The Operations View dashboard now includes two new scores that provide greater transparency into the operational clean core compliance of eligible systems.
The new Overall Operations Score represents the average clean core compliance across all eligible systems for the operations principle. The score is calculated as a weighted mean based on two area scores:
System Health
Operations Setup
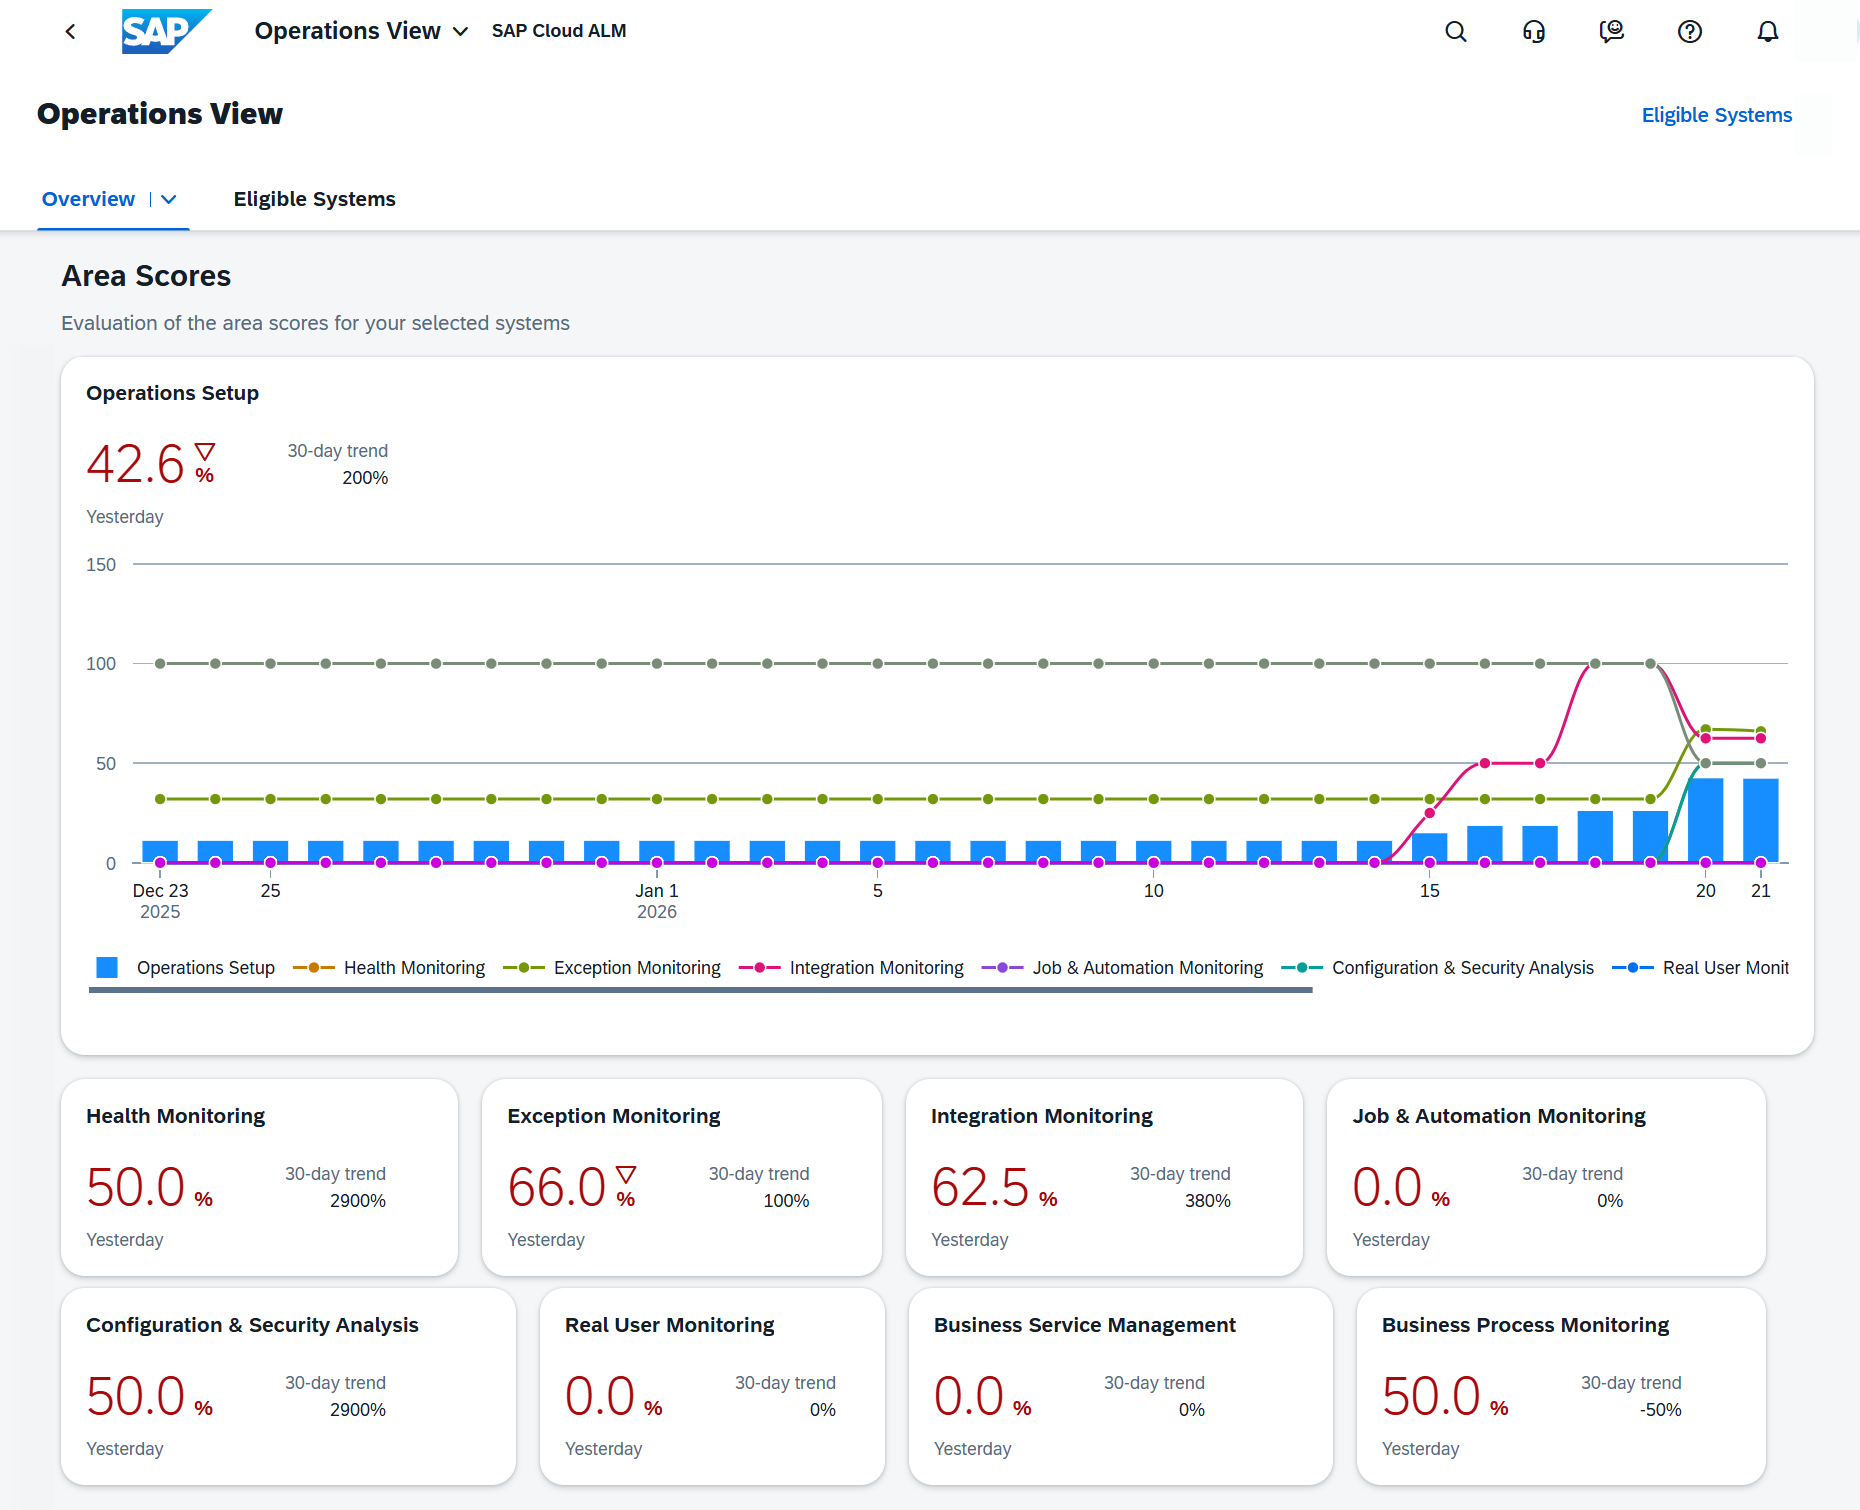
The newly introduced Operations Setup score evaluates how well systems are configured from an operational perspective. It is based on KPIs and metrics from:
Health Monitoring
Exception Monitoring
Integration Monitoring
Job & Automation Monitoring
Configuration & Security Analysis
Real User Monitoring
Business Service Management
Business Process Monitoring
For a detailed breakdown, select a system under the Eligible Systems tab to open the Operation Details view and review the contributing metrics.
TL;DR:
The Operations View now includes an Overall Operations Score and a new Operations Setup score, providing clearer insight into clean core compliance and operational readiness across eligible systems.
The latest Operations updates enhance transparency across system integrations, automation, and monitoring. With improved connection insights, expanded message monitoring support, refined data management settings, and additional clean-up capabilities, teams gain better visibility, stronger control, and more efficient landscape governance across complex environments.
Flow Discovery and Extended Product Support in Integration & Exception Monitoring
Integration & Exception Monitoring continues to expand both transparency and product coverage.
With Flow Discovery, connections between managed services and systems can now be identified automatically. When enabled, the feature correlates messages across components, detects system-to-system relationships, and logs this information for reuse by other SAP solutions.
Currently, Flow Discovery is supported in combination with SAP LeanIX.
In addition, monitoring coverage has been extended with support for:
Commodity Expense Management – Monitor SAP Expense Management messages with detailed status overviews and drill-down capabilities.
SAP Digital Currency Hub – Gain visibility into incoming and outgoing messages, including detailed message-level insights.
These enhancements strengthen landscape transparency while expanding monitoring coverage for key business solutions.
TL;DR:
Flow Discovery reveals system connections across the landscape, while new monitoring support for Commodity Expense Management and SAP Digital Currency Hub extends integration visibility.
Enhanced Application Settings Transparency in Job & Automation Monitoring
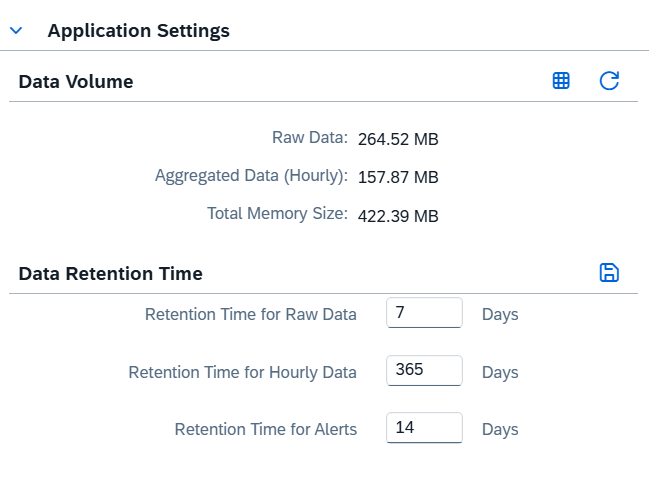
The Application Settings in the Configuration menu have been enhanced to provide clearer visibility into data volume and retention settings.
In the Data Volume section, the app now displays:
Raw Data size
Aggregated Data (Hourly) size
Total Memory Size
In the Data Retention Time section, the following values are now shown:
Retention Time for Raw Data
Retention Time for Hourly Data
Retention Time for Alerts
Please note that regardless of the configured retention time for raw data, 15 job instances (and up to 100 alerted job instances) are always stored.
These updates improve transparency around storage usage and retention policies, helping administrators manage monitoring data more effectively.
TL;DR:
Application Settings now provide clearer insight into data volume and retention times, with defined minimum storage rules for job instances.
Clean-Up Option in Landscape Management
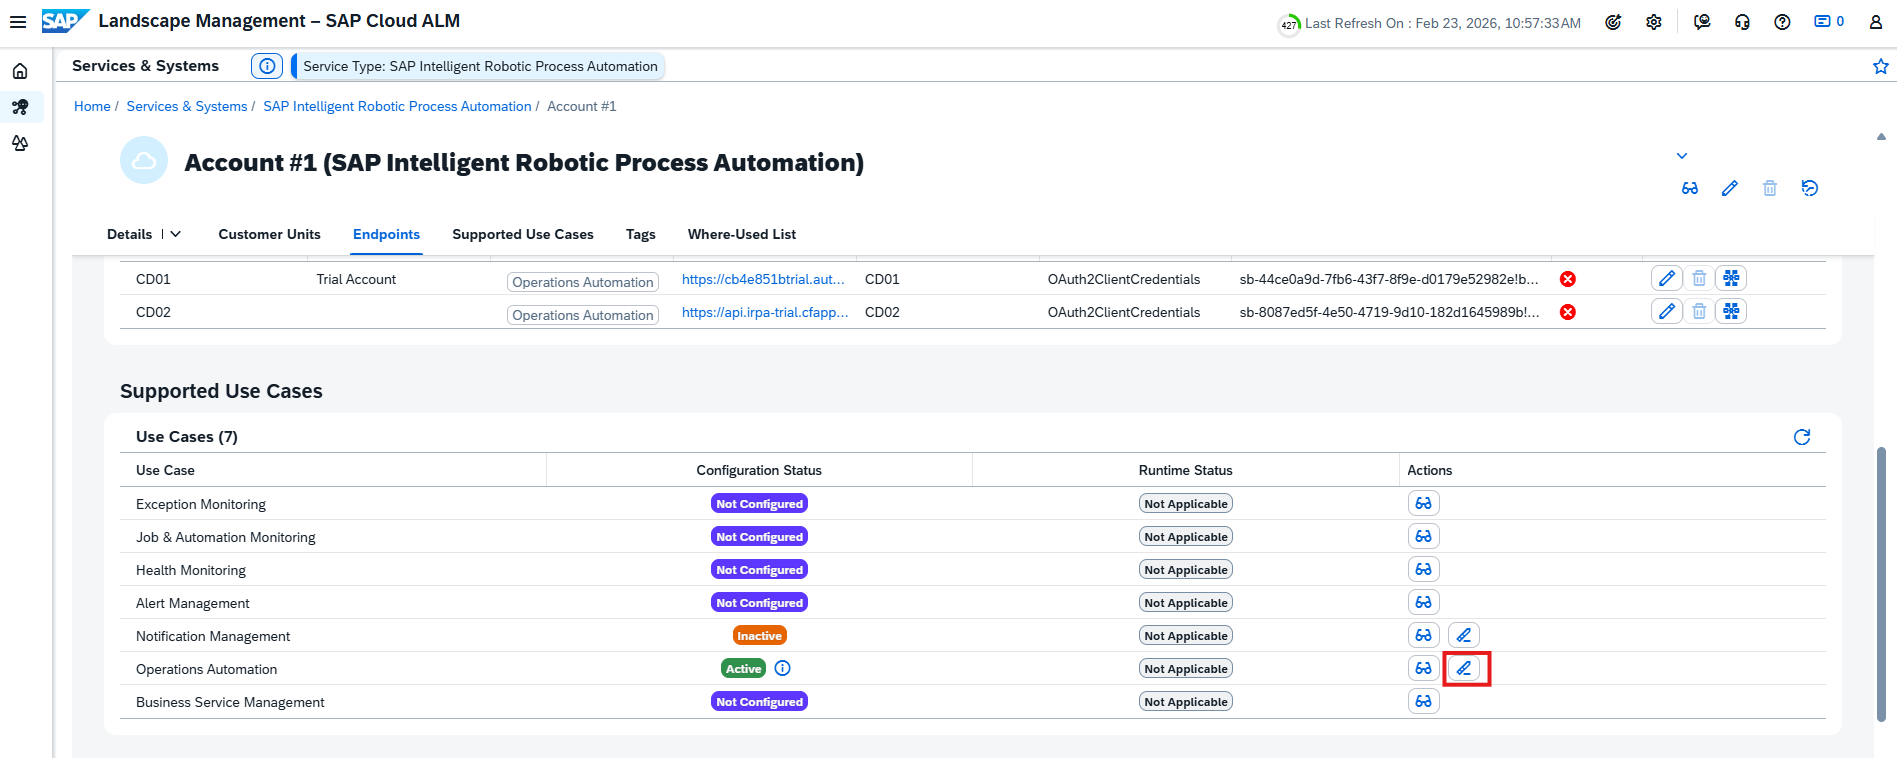
A new clean-up option is now available for Operations Automation in the Landscape Management app.
Using the Clean-Up option in the Actions column under Services/Systems – Supported Use Cases, administrators can delete the Operations Automation configuration and all related data for a selected service or system.
After clean-up:
The Operations Automation configuration is removed
Collected data is deleted
The service or system moves to a Not Configured state
This helps maintain a lean monitoring setup and remove obsolete configurations when services or systems are no longer required.
TL;DR:
Operations Automation settings and data can now be cleaned up directly in Landscape Management to keep configurations streamlined.
The most important features are there, the retrofit categorization is in place, but there are still a few dark spots that we would like to shed some light on here.
SAP Cloud ALM continues to evolve with focused updates that strengthen transparency and operational insight.
Week 6 release introduces enhanced monitoring and analysis in Operations, more efficient user and project management in Administration and Implementation, and practical usability improvements that simplify day-to-day work.
Together, these updates help teams manage complexity more effectively, reduce manual effort, and maintain better control across their SAP Cloud ALM landscape.
SAP Business Transformation Center – Scoping
The latest updates in SAP Business Transformation Center continue to strengthen transparency and control during transformation preparation. With clearer system scan insights and improved visibility into source data structures, teams can make more informed scoping decisions and reduce surprises later in the migration journey.
System scan results now includes client-dependent tables and client-independent custom tables
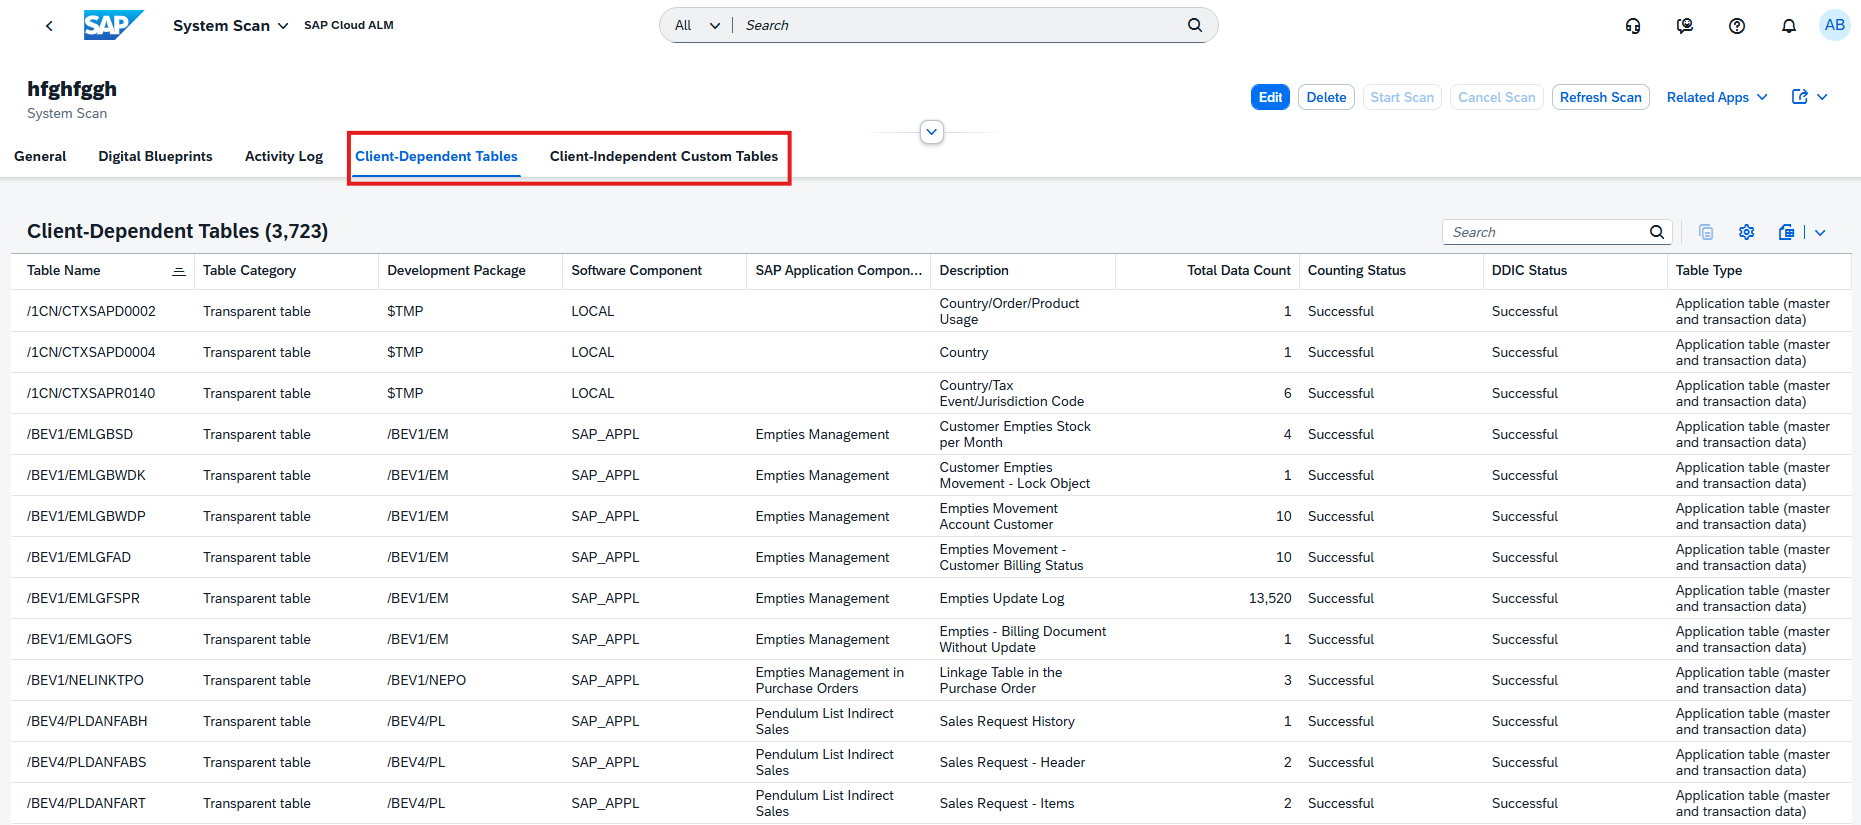
The latest update in the Scoping area of SAP Business Transformation Center improves transparency during system analysis by extending the scope of system scan results.
With this enhancement, system scans now include both client-dependent tables and client-independent custom tables in a single, consolidated view. This gives transformation teams a more complete picture of the SAP ERP source system early in the scoping phase, helping them better understand the overall data footprint.
Client-dependent tables continue to support scoping decisions and can be reviewed and adjusted in the Select Scanned Tables app as before. In addition, a new tab now displays client-independent custom tables (for example, Z*, Y*, or custom namespaces). These tables are shown for informational purposes only and cannot be scoped, as they are currently not covered by the Lean Selective Data Transition scenario from SAP ERP to SAP S/4HANA.
By clearly separating client-dependent and client-independent tables, the system scan helps teams identify custom tables that may require special handling. While client-independent custom tables are not included in the standard migration scope, their visibility allows teams to proactively assess whether they are needed in the target system and plan alternative transfer approaches if required.
TL;DR:
System scans now show both client-dependent and client-independent custom tables, giving a complete overview of the source system while clearly indicating which tables are scoping-relevant and which are informational only.
Operations – Health Monitoring, Integration & Exception Monitoring, Business Process Monitoring
The latest updates in the Operations area focus on greater transparency, smarter monitoring, and better control of system resources. Enhancements across monitoring apps make it easier to understand what is being monitored, how systems and services are consuming resources, and where attention is needed – helping operations teams act faster and manage complex landscapes more efficiently.
New RFC metrics available in Health Monitoring
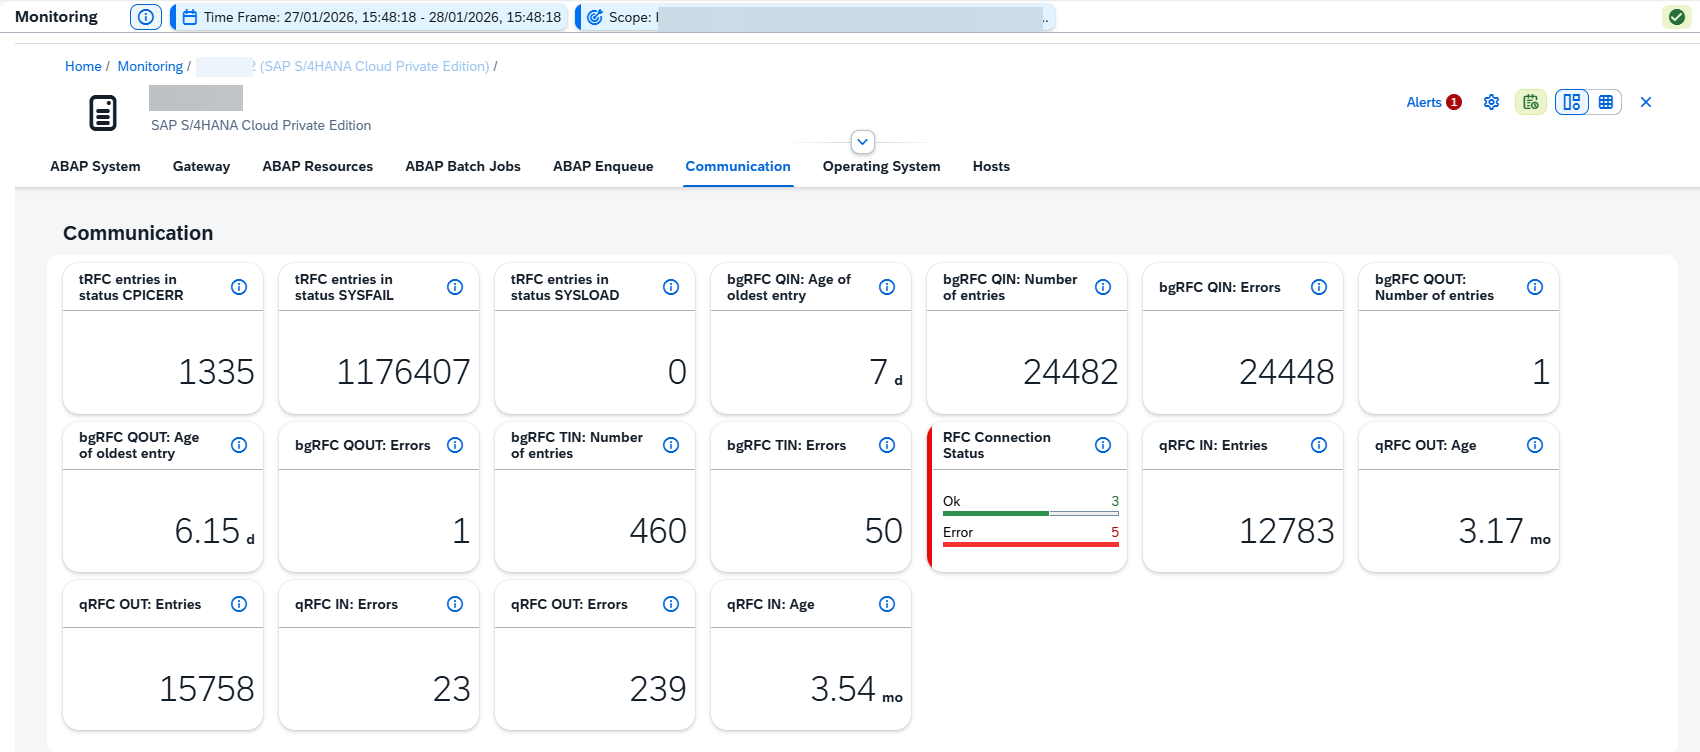
Health Monitoring has been extended with comprehensive RFC metrics, giving operations teams deeper insight into remote communication and background processing health.
The update introduces monitoring for tRFC, qRFC, and bgRFC, allowing teams to track transactional, queued, and background RFC calls more effectively.
In addition, a new RFC Connectivity Status metric provides visibility into the availability of RFC destinations, helping to quickly detect and troubleshoot communication issues between systems. The RFC connectivity metric also comes with configurable options, making it possible to tailor monitoring to specific operational requirements and critical connections.
RFC monitoring capabilities are available only when ST-PI 740 SP33 is installed.
TL;DR:
Health Monitoring now supports detailed RFC metrics (tRFC, qRFC, bgRFC) and RFC connectivity status, improving visibility into system communication and background processing.
Support for SAP Complaint Handling in Integration & Exception Monitoring
Integration & Exception Monitoring has been extended to support SAP Complaint Handling, giving operations teams full visibility into complaint-related message flows. With this update, incoming and outgoing messages can be monitored across the following message types:
SAP Complaint Handling Configuration Messages
SAP Complaint Handling Master Data Messages
SAP Complaint Handling Transactional Messages
For each message type, a detailed status overview is available, allowing teams to quickly assess processing health. From the overview, it’s possible to drill down into individual messages to analyze errors, investigate delays, and review technical message details. As with other supported integrations, data collection is handled via SAP-Managed Connectivity, ensuring a consistent and low-effort setup.
This enhancement helps teams proactively detect integration issues in complaint handling scenarios and respond faster when business-critical messages fail or behave unexpectedly.
TL;DR:
Integration & Exception Monitoring now supports SAP Complaint Handling, providing end-to-end visibility into configuration, master data, and transactional messages with drill-down capabilities for faster issue analysis.
Improved KPI Transparency and Memory Insights in Business Process Monitoring
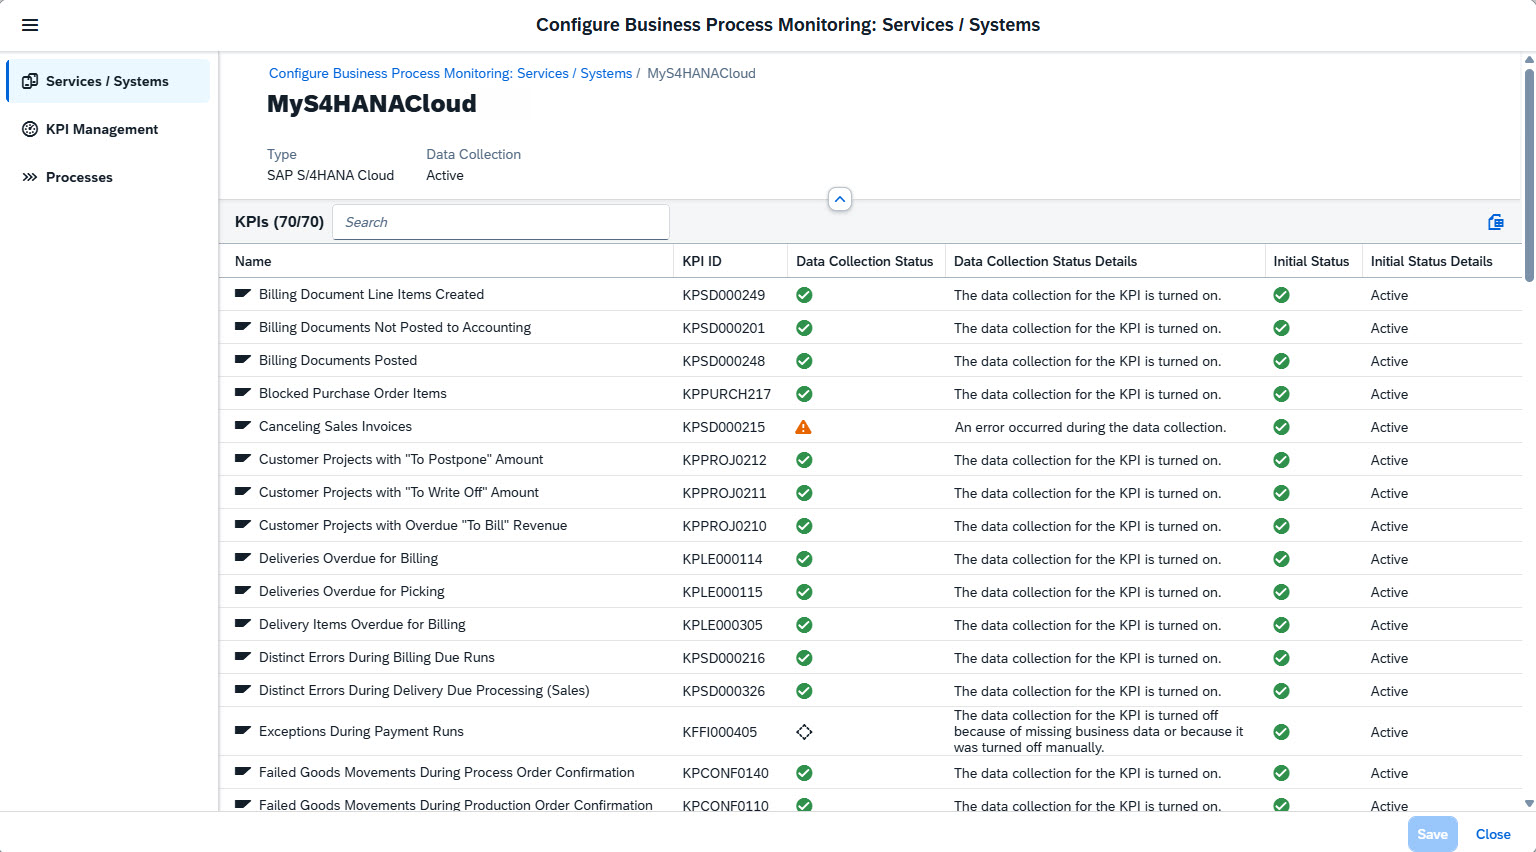
Business Process Monitoring now offers deeper transparency into how KPIs are configured and how system resources are consumed. In the configuration dialog, the Services / Systems page has been enhanced to show a complete list of all KPIs assigned to each service or system, including relevant context information and data collection details. This makes it easier to understand which KPIs are active where and why.
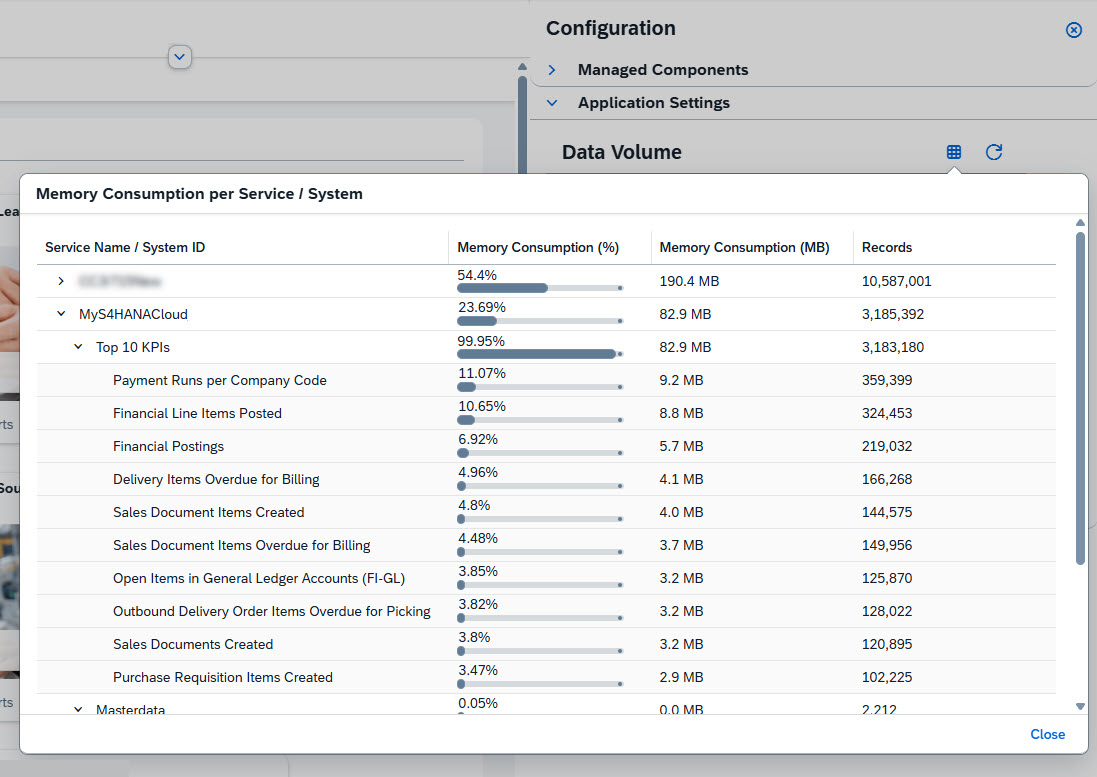
In addition, Process Monitoring Administrators can now analyze memory consumption per service or system. Using the Tabular Display per Service view in the Data Volume section, it’s possible to see how memory usage is distributed across services and systems, as well as their top 10 KPIs. This insight helps teams identify KPIs with high resource consumption and fine-tune monitoring configurations accordingly.
Together, these improvements support more informed decisions about KPI activation and data collection, helping to balance monitoring depth with efficient memory usage.
TL;DR:
Business Process Monitoring now shows KPIs per service/system and their memory consumption, making it easier to optimize KPI setups and manage resource usage effectively.
The latest updates in the Implementation area focus on giving teams more control, better insight, and greater efficiency throughout project execution. From improved analytics and reporting, to enhanced risk, quality gate, and transport handling, these enhancements reduce manual effort and make it easier to manage complex projects with confidence and transparency.
Enhanced Risk Management
Risk handling in SAP Cloud ALM is now more tightly integrated with project execution. The Risks app has been extended with new capabilities that help teams actively mitigate risks and work more efficiently at scale.
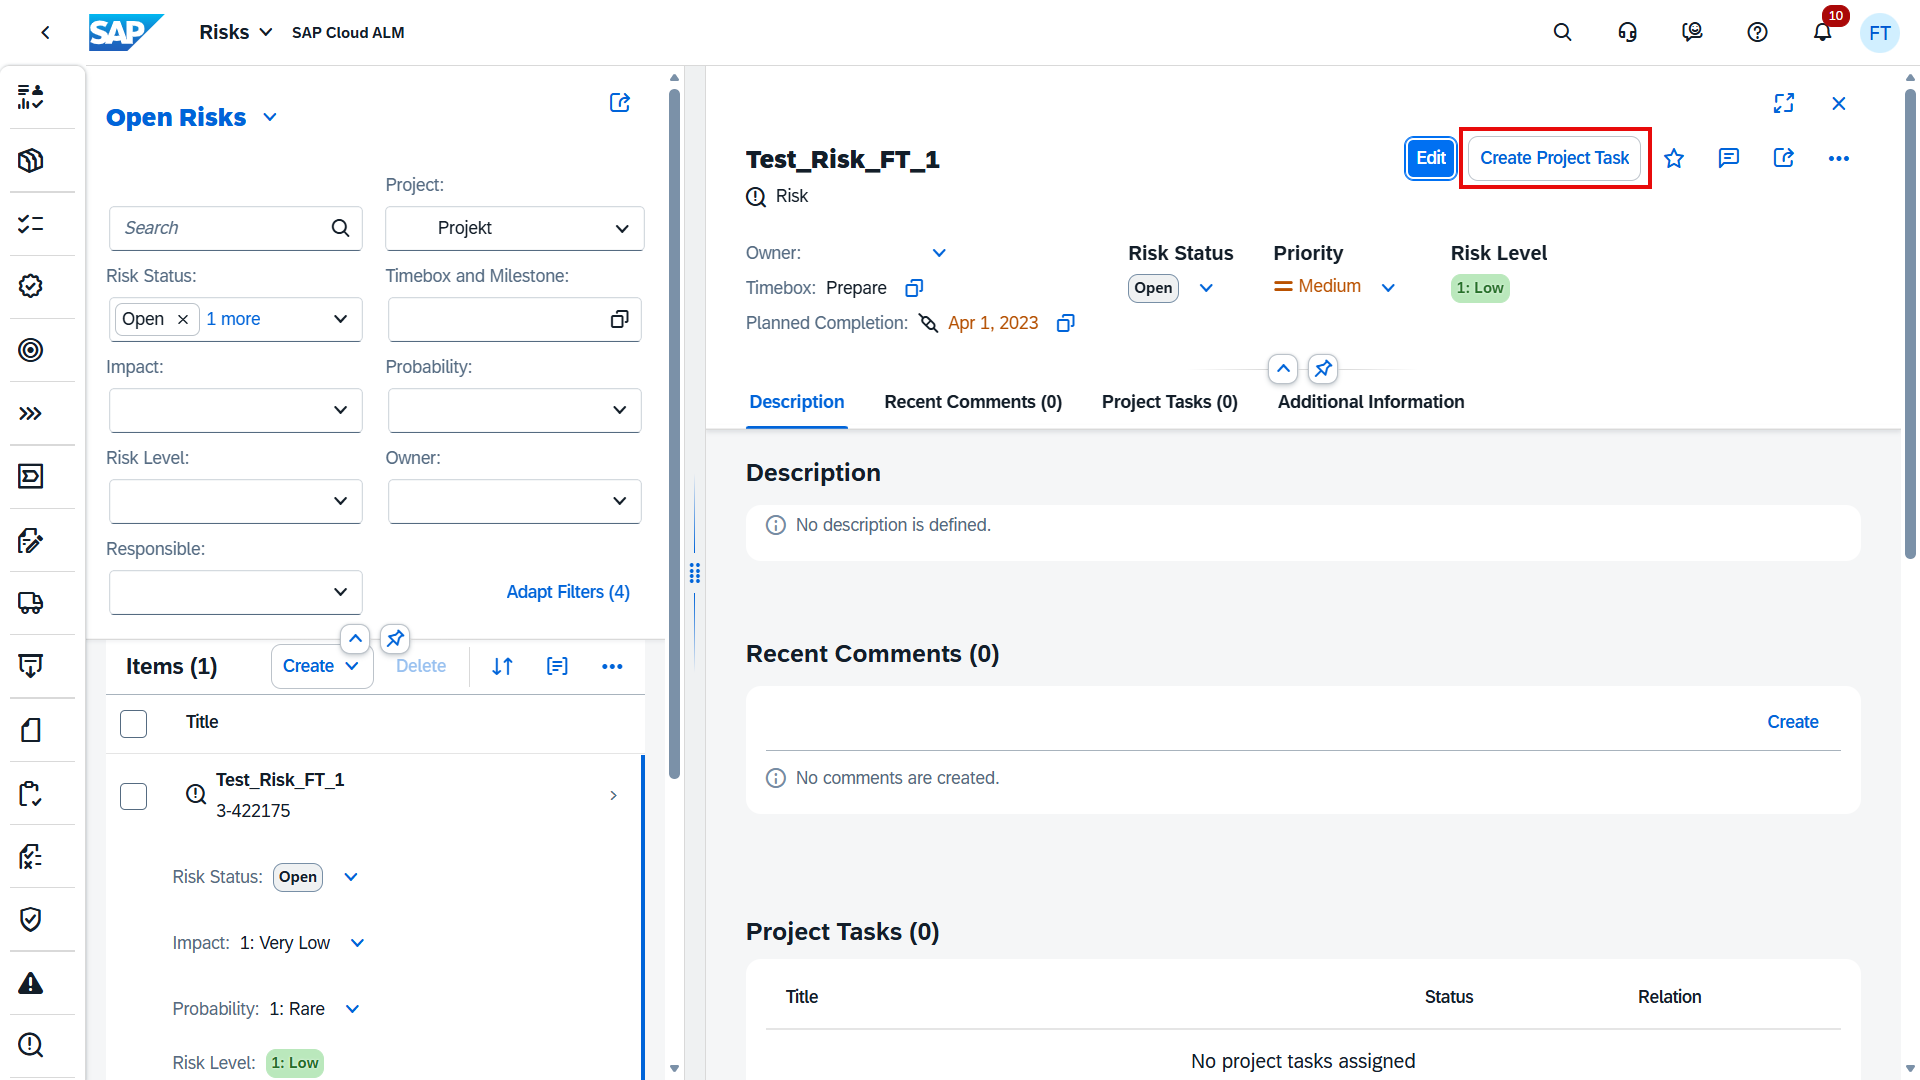
Project managers can now create new project tasks or assign existing ones directly from a risk, making it easier to translate identified risks into concrete actions and follow-ups without switching apps. This strengthens the link between risk identification and execution.
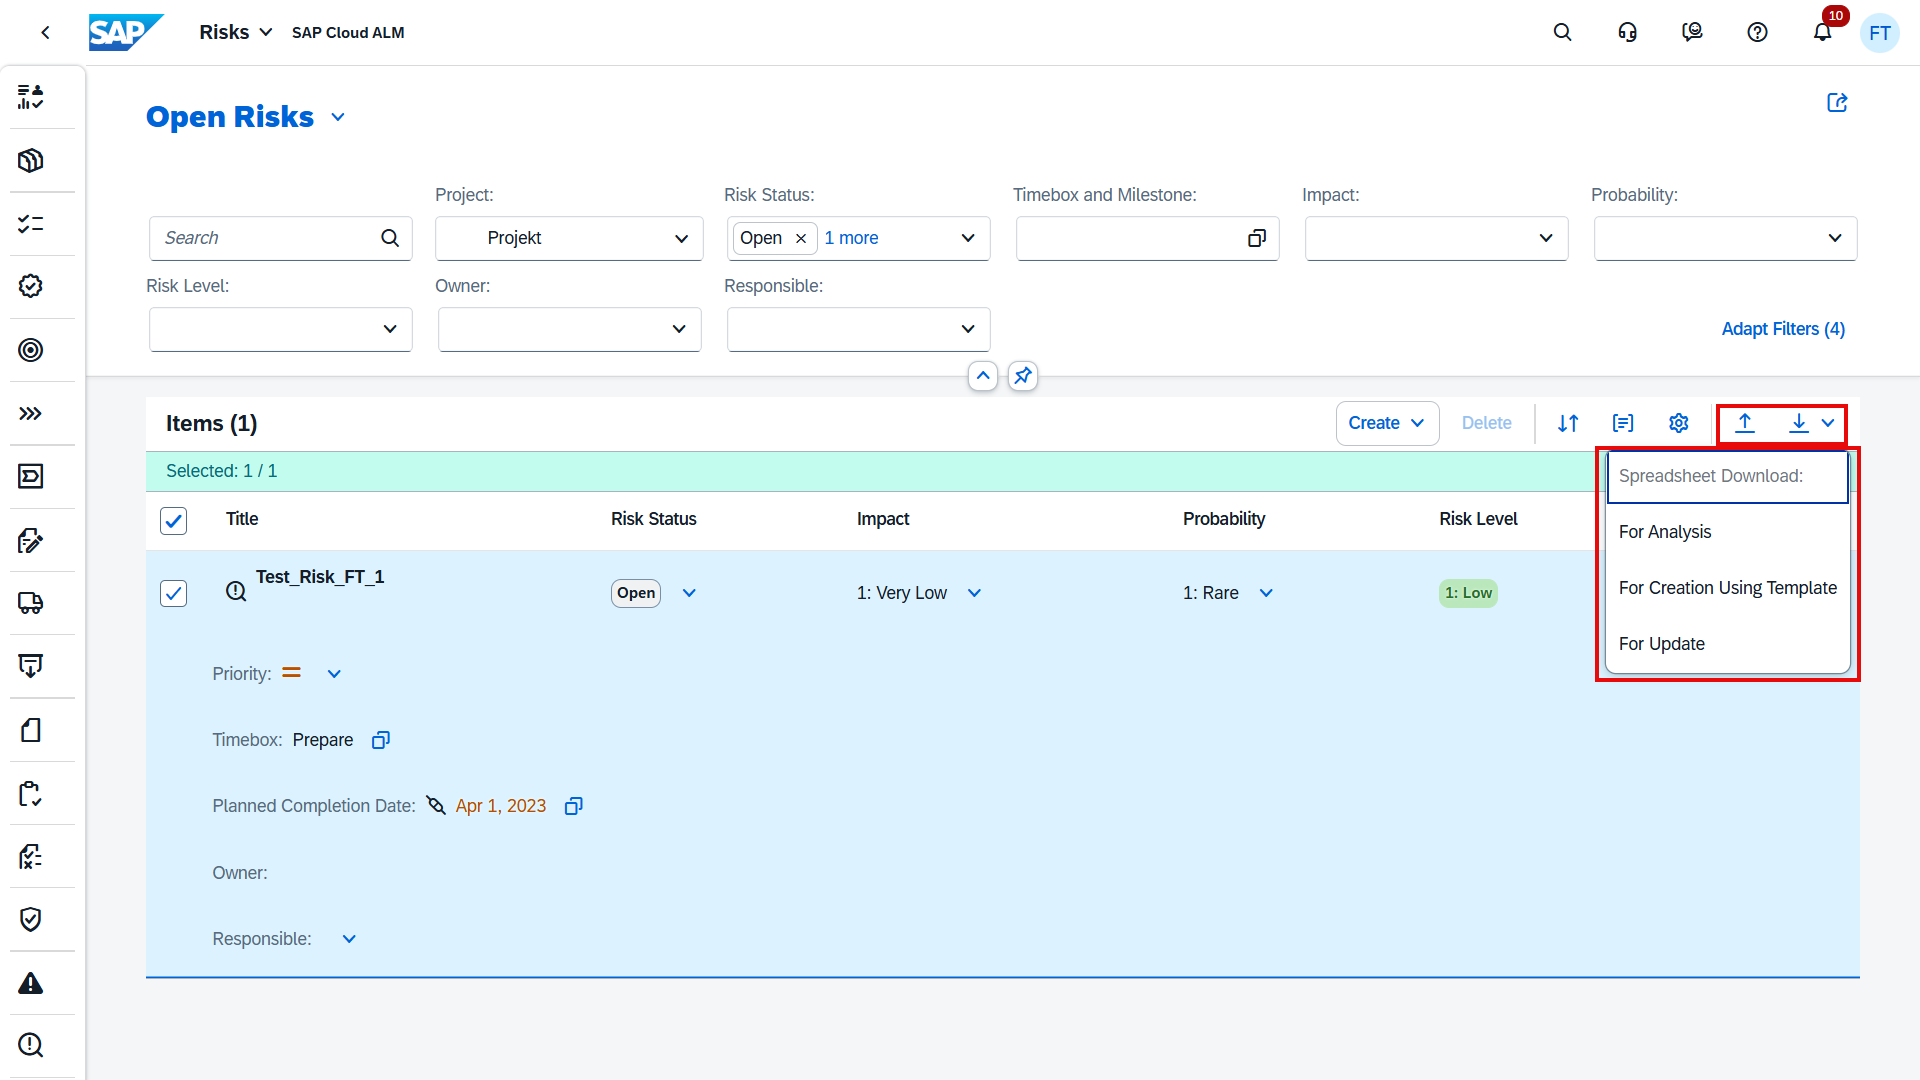
In addition, the Risks app now supports downloading and uploading spreadsheets. This enables mass editing, offline analysis, and easier collaboration when working with larger risk registers or during preparation and review phases.
TL;DR:
Create and assign project tasks directly from risks and manage risks at scale using spreadsheet download and upload for faster analysis and updates.
Quality Gates: Faster Analysis, Mass Editing, and Automated Assessments
The Quality Gates area has received several powerful enhancements that make managing checklists more efficient, scalable, and actionable – especially in larger or highly regulated projects.
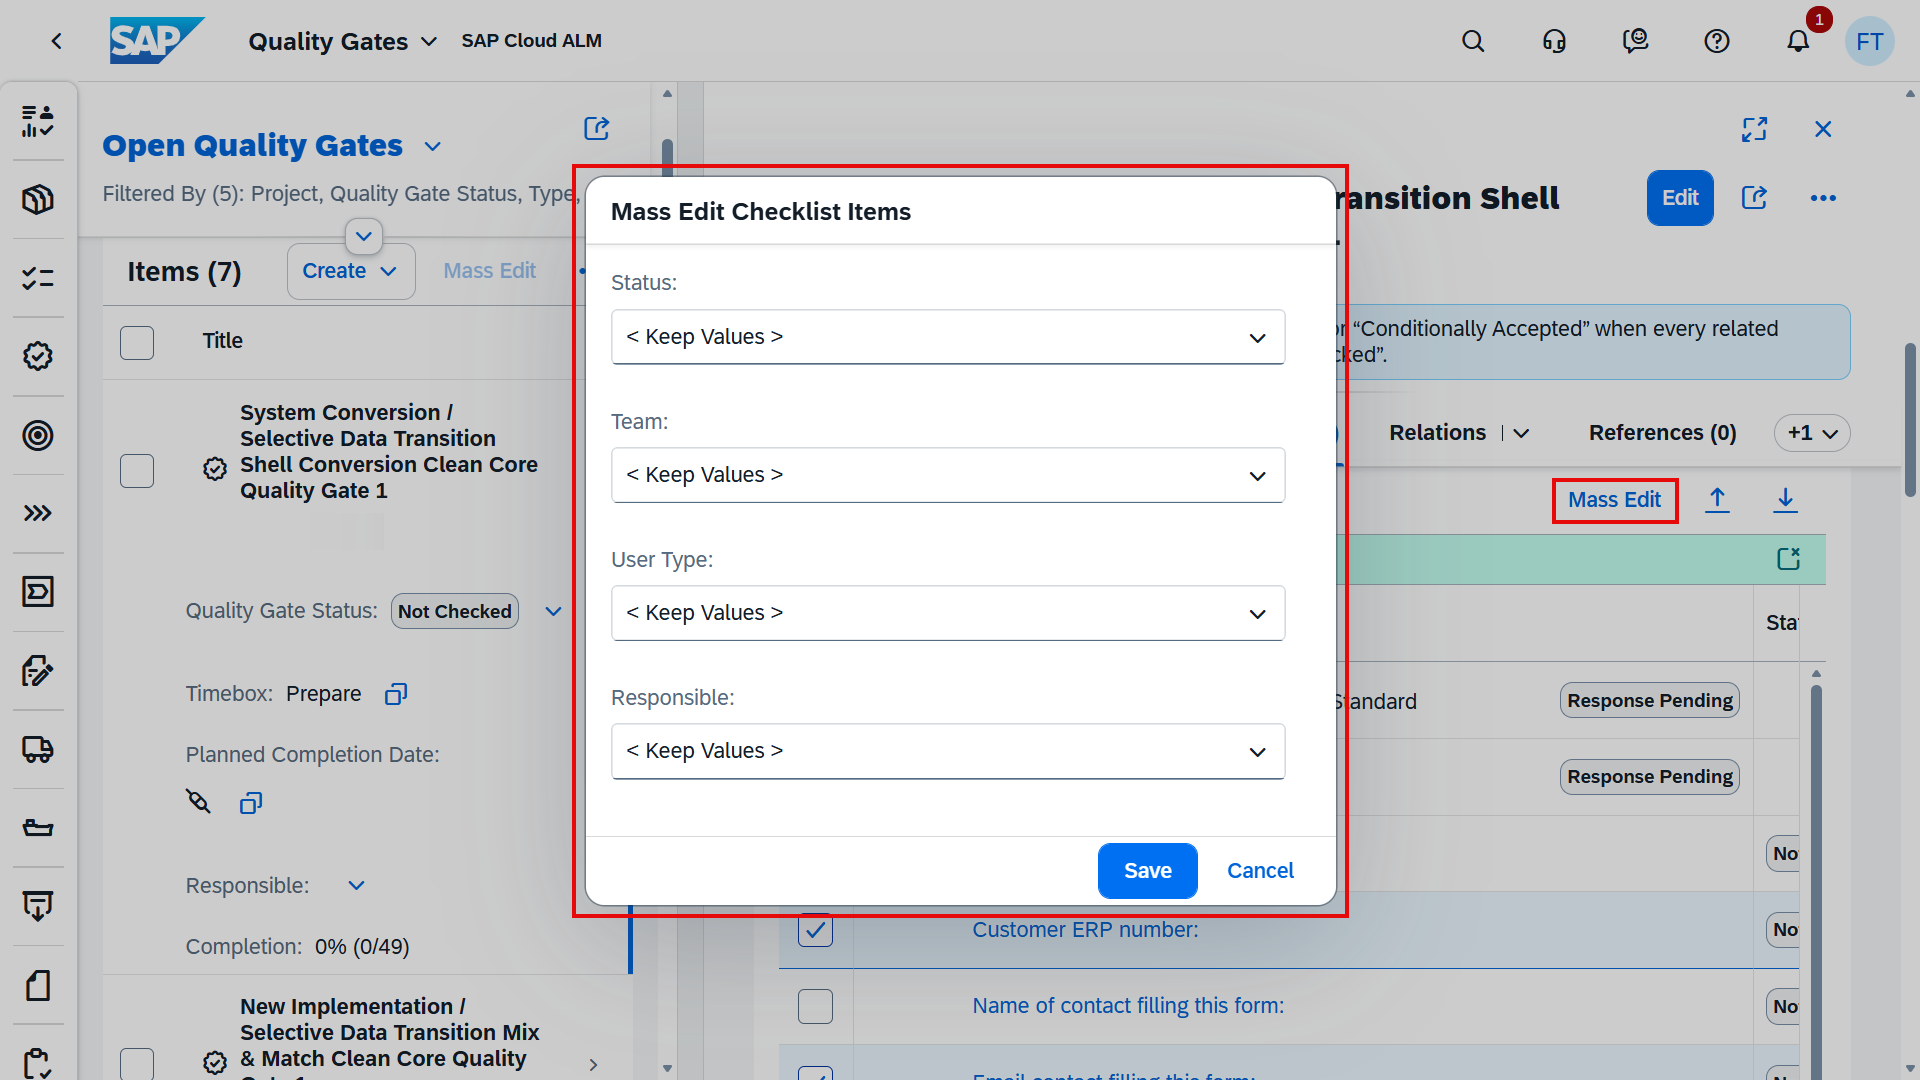
Teams can now download checklist items from dynamic quality gates into spreadsheets for offline analysis and mass editing. After updates are made, the spreadsheets can be uploaded again to create new checklist items or update existing ones. This is complemented by a new mass edit capability directly in the app, allowing multiple checklist items to be updated in one go without relying on external tools.
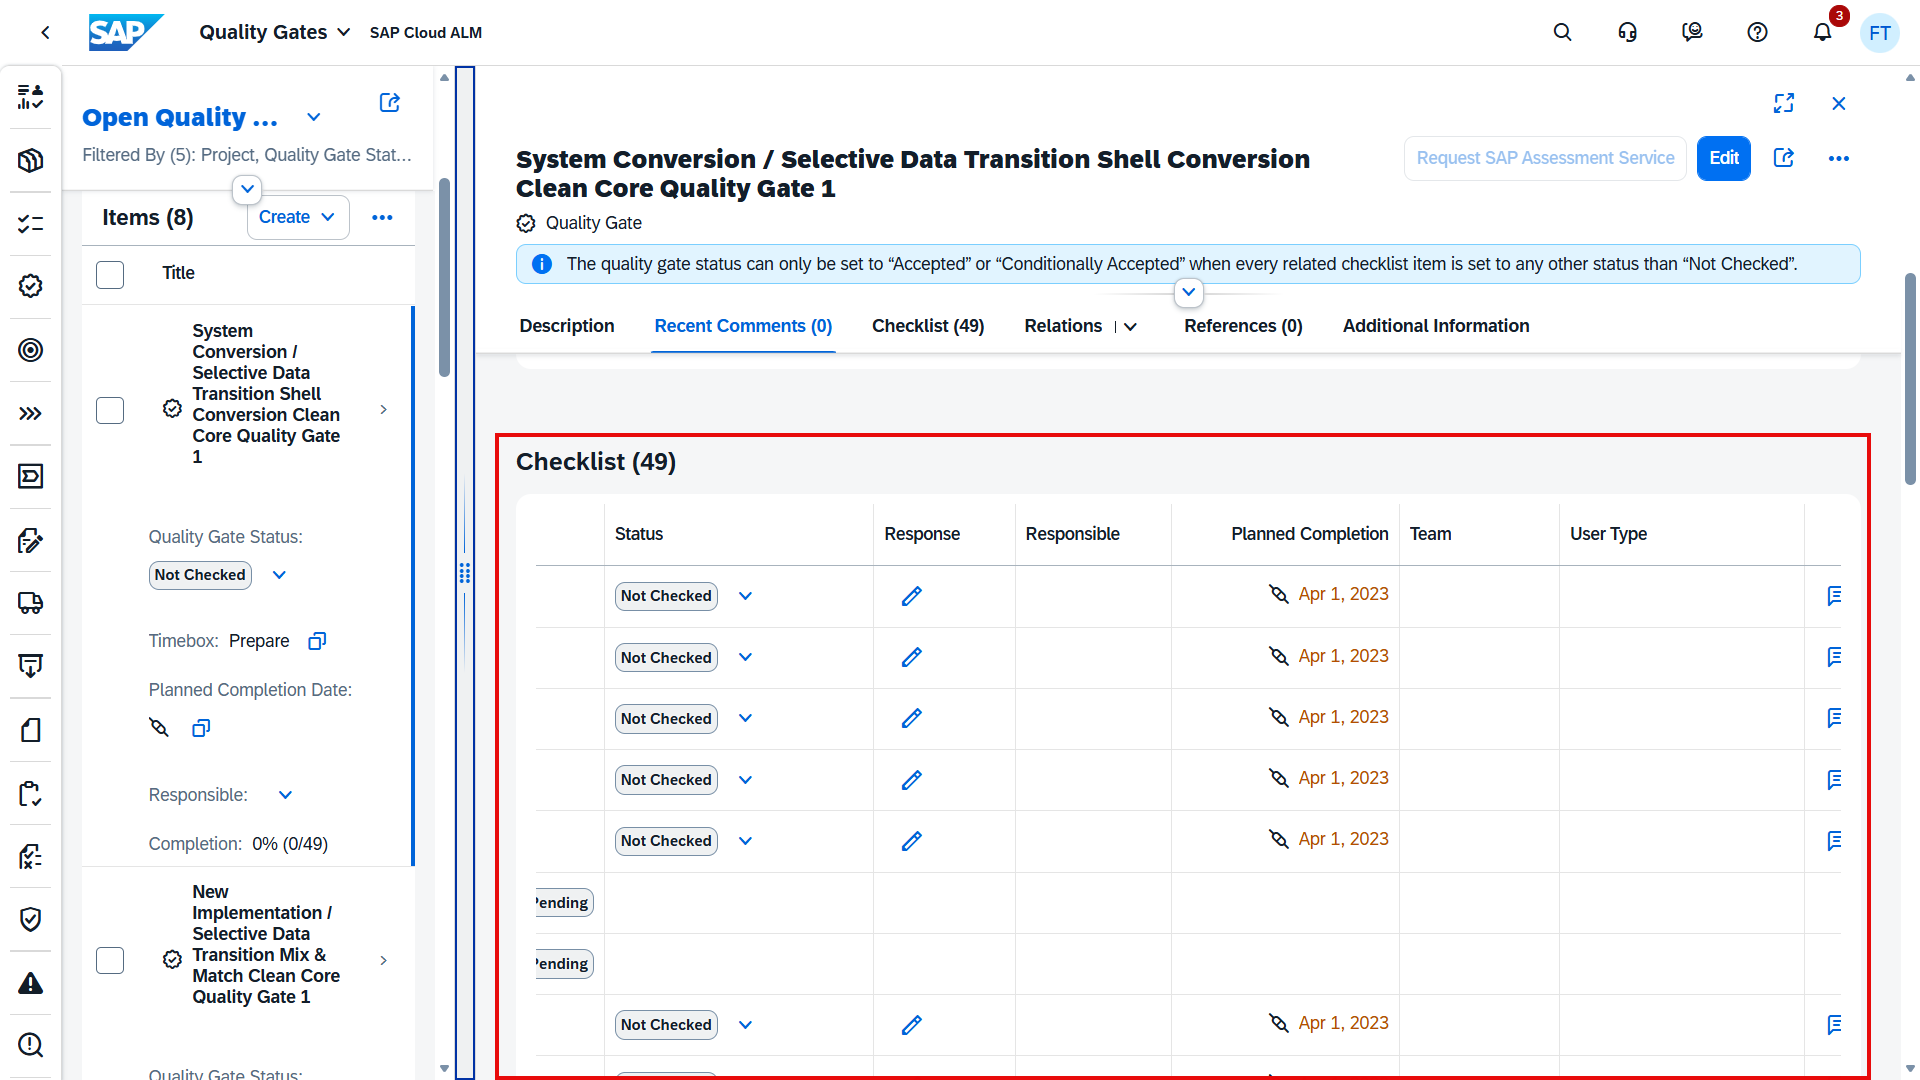
Visibility and control have also improved. In the hierarchical checklist view, project teams can now view and edit all existing checklist item attributes, including Responsible, Planned Completion, Team, User Type, and Comments. This makes it much easier to manage ownership, timelines, and accountability across quality gates.
In addition, project leads can now request a fully automated SAP Assessment Service for selected dynamic quality gates. This is available for:
SAP Activate Roadmap – SAP S/4HANA Cloud Public Edition (Prepare & Explore)
SAP Activate Roadmap – SAP SuccessFactors (Prepare & Explore)
This service helps accelerate assessments while ensuring consistency with SAP best practices.
TL;DR:
Quality Gates now support spreadsheet-based analysis and mass editing, full attribute maintenance in dynamic checklists, and automated SAP Assessment Services – making quality management faster, more transparent, and easier to scale.
Features: Better Transparency in Transport Handling
Transport handling in the Features area is now more transparent with two small but practical enhancements.
In the Transports section, the transport owner is now displayed directly. This makes it easier for project teams to quickly identify responsibility, clarify ownership, and coordinate follow-ups without switching tools or digging into transport details.
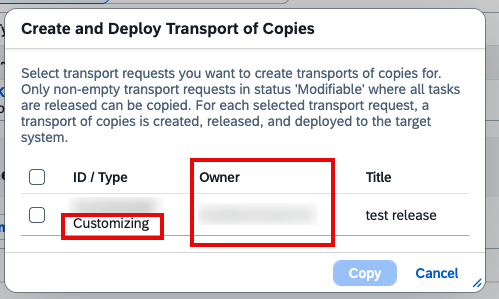
In addition, the Create Transport of Copies dialog has been enhanced to show both the transport type and the owner. Having this context available upfront helps avoid mistakes during transport creation and supports better decision-making when selecting or reusing transports.
Together, these improvements reduce ambiguity and make day-to-day transport management clearer and more efficient.
TL;DR:
Transport owner and transport type are now visible in key places, improving transparency and responsibility in transport management.
Analytics: Smarter Search, Better Traceability, and Risk Insights
The Analytics area in SAP Cloud ALM continues to mature with updates that make it easier to find relevant data, understand relationships, and gain clearer project insights.
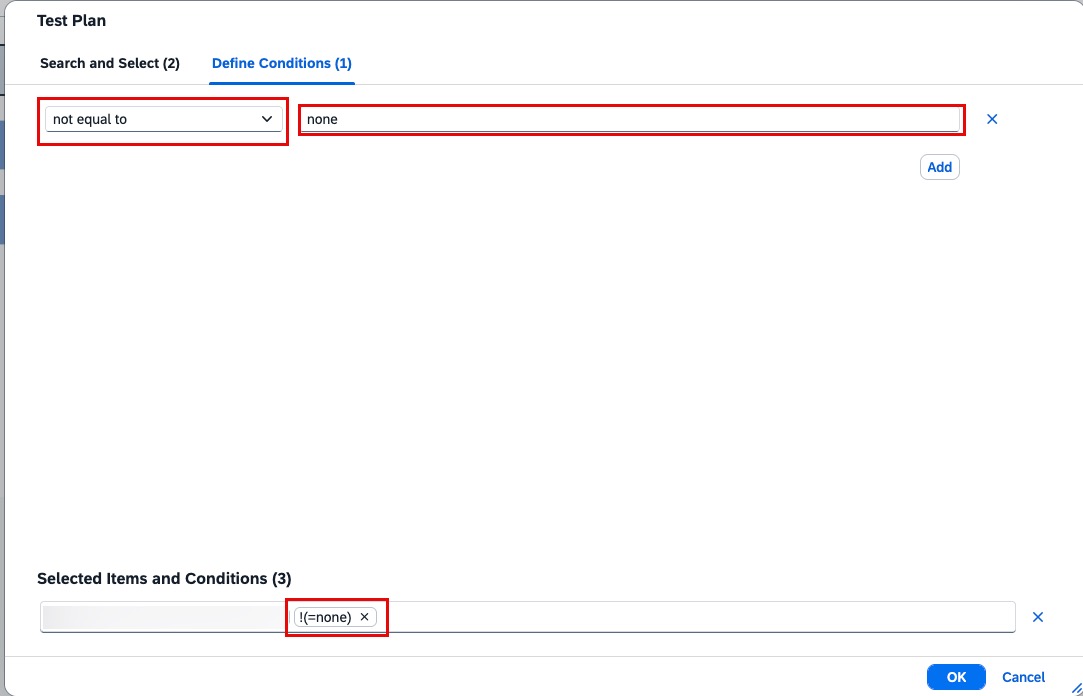
Enhanced test plan search and filtering is now available via a new Value Help dialog in the Defect Reporting app. The dialog includes a dedicated search field and a Define Conditions tab, allowing more precise filtering. For example, test cases assigned to the None test plan can be excluded by using a not equal condition. This makes defect reporting cleaner and ensures that only relevant test plans are considered during analysis.
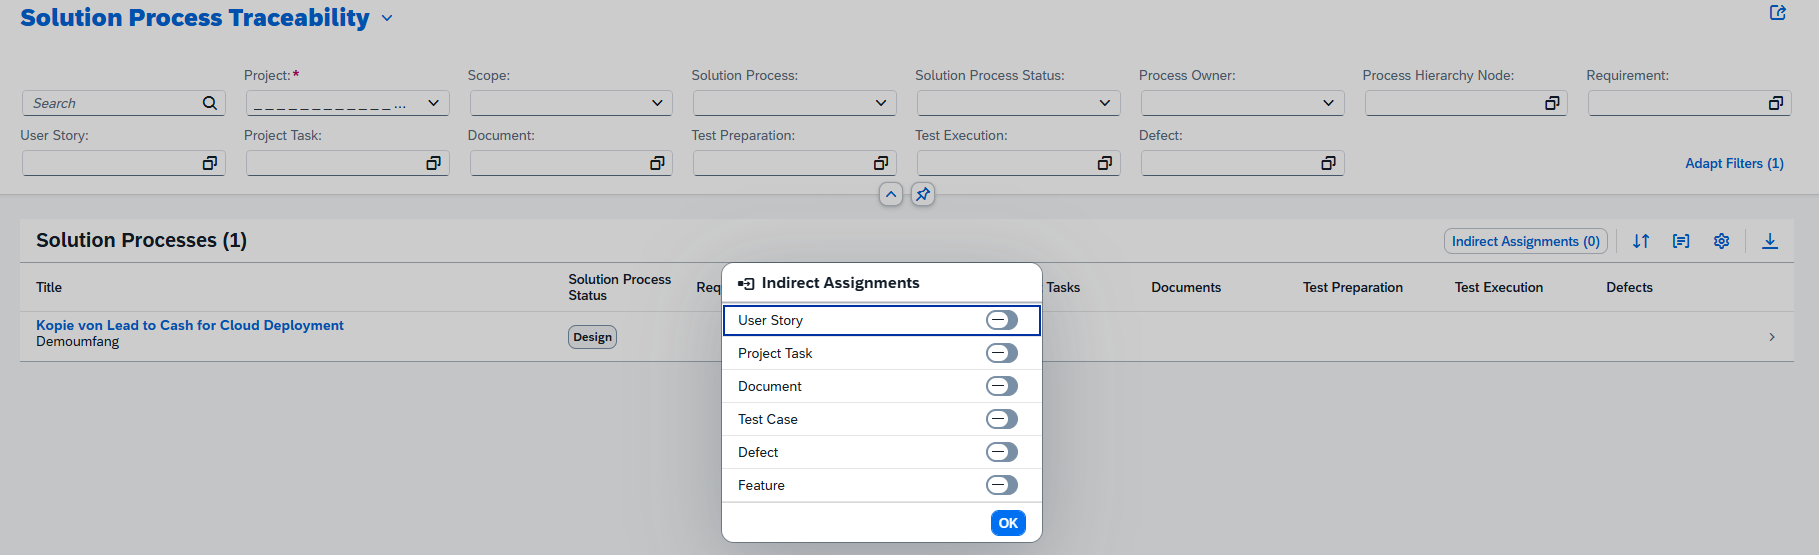
Indirect document assignments are now visible in the Solution Process Traceability app. Documents that are indirectly linked through Requirements, Tasks, Defects, or Library items can be displayed by enabling the Indirect Assignment option and switching on the Document toggle. Document counts, micro-bar charts, and direct access to document details are updated automatically, providing a more complete view of documentation coverage across processes.
TL;DR:
Analytics now offers improved test plan filtering, visibility of indirectly assigned documents in traceability views.
Administration – User Management
Mass Maintenance of Users
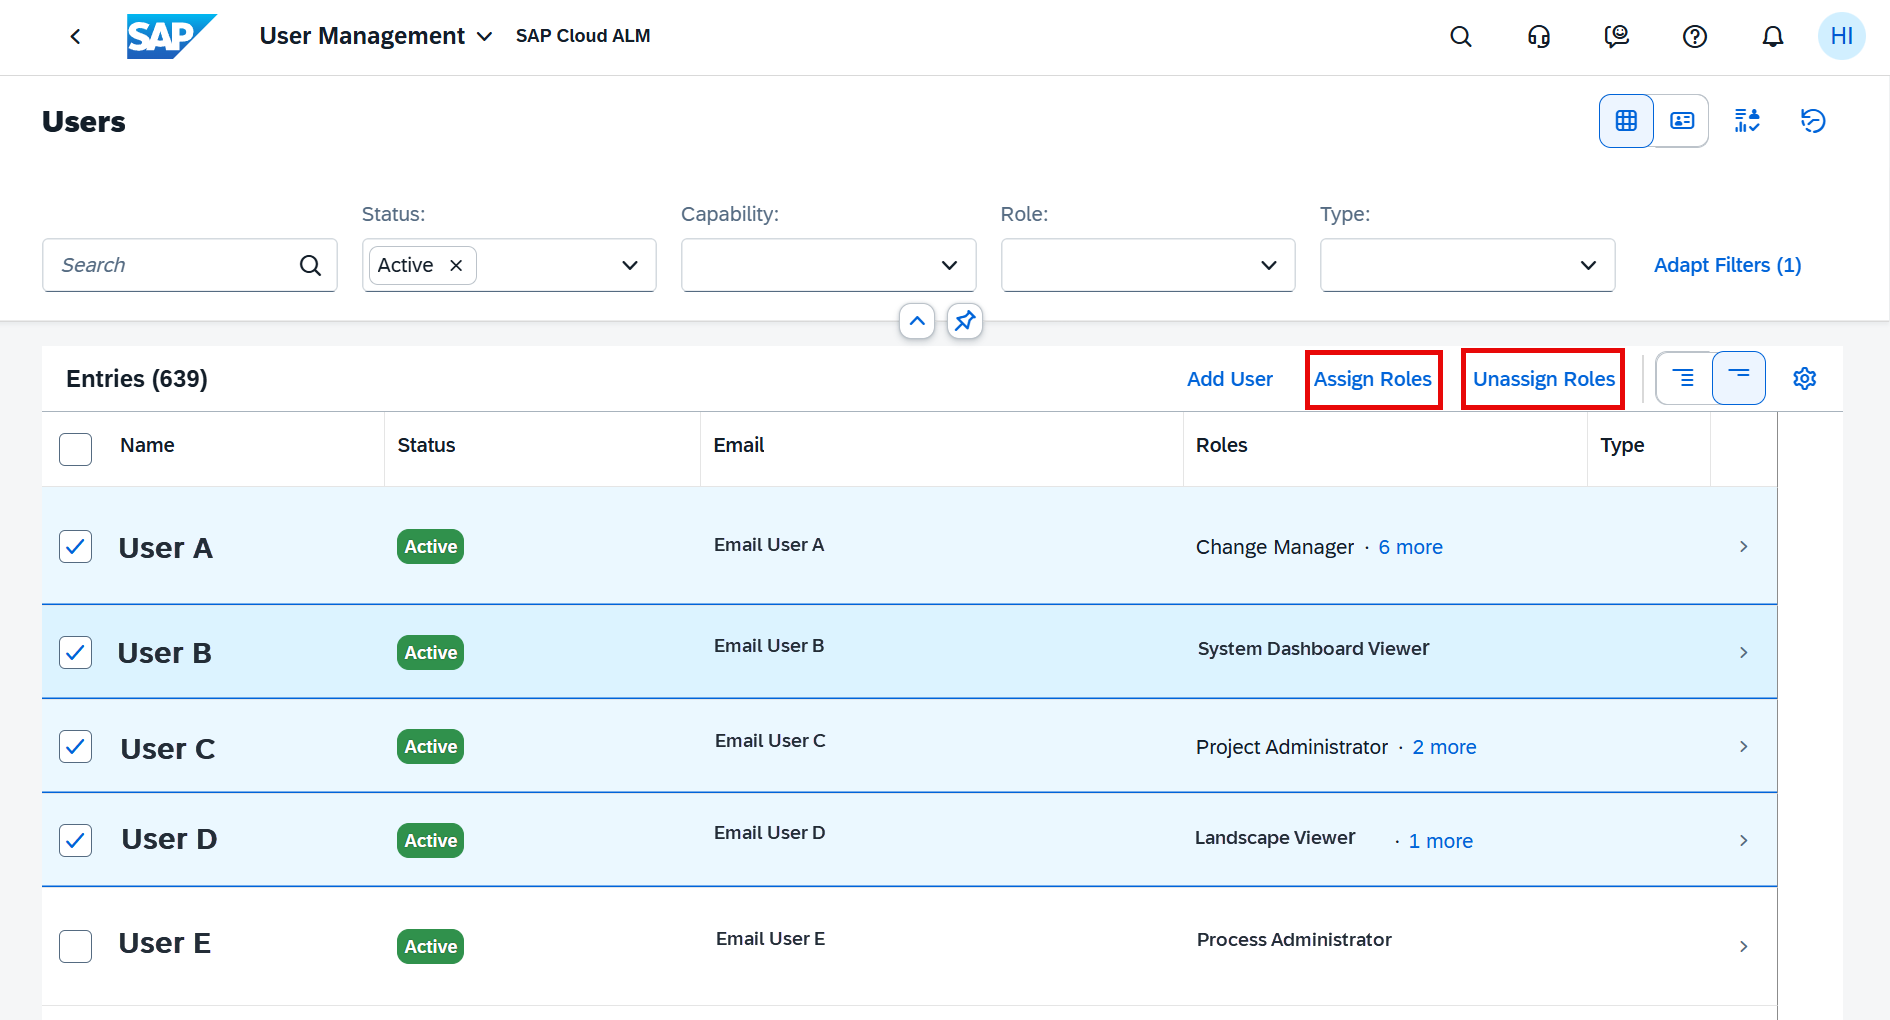
User administration becomes more efficient with mass maintenance for role assignments. Administrators can now assign or remove roles for multiple users in one step directly from the Table View in the User Management app.
This enhancement simplifies large-scale user updates and reduces repetitive manual effort when managing access across teams.
Key points:
Assign or unassign roles for multiple users at once
Up to 50 users can be edited in a single action
Users with the following statuses can’t be edited:
Deactivated
Expiring Soon
Waiting for Approval (and not maintained in SAP BTP Cockpit)
TL;DR:
Manage user roles faster by assigning or removing roles in bulk – ideal for keeping access aligned at scale.
We use cookies and similar technologies to improve your experience on our website.